
Drivers of Form - April 2021
Every month, we dedicate time to reflect on how the FormScore community feels, what the main drivers are, and think of ways to support you.
Here is what we observed in April: The overall average score was 6.73, which is an improvement compared to March’s overall average score of 6.55. The report below suggest that this is due to Exercise, Weather and Connections.
As the weather gets better, we spend more time outdoors, enjoying the warmer days, exercising and connecting with friends and family. As the data show, spending more time in nature and enjoying the weather is good for our mental health.
The changes in the drivers of form, show that we felt better in April than in March. Drivers that were previously logged as positive (logged with a high score) became even more positive (logged with an even higher score). Those logged as negative (low score), became less negative (logged with a higher score). This shows that April was a good month in the Form family.
Your April in Form

It’s great to see that, overall, we were in better form in April compared to February and March. We also reached a new high average score of 6.73.
The main drivers that helped us achieve a higher score and improve our form were Exercise, Weather and Connections.
When logging our score, we selected Energy the most, which also had a positive impact on our form.
As always, some drivers have a negative impact on our form. What’s important is to take a moment to notice how we feel and what triggers the change in our form. Only then we can look into ways to improve it and ultimately become more intentional about our wellbeing.
It will come as no surprise that Stress and Work had the most negative impact on our form. They were also logged as the lowest average score. This is the second consecutive month we see this pattern.
What do you do to better manage stress and show up at work in your best form? Find out the answer in Rob’s Form Booster series:
Most selected Drivers of Form

When we compare the drivers of form logged in April, with those logged in March:
Energy and Sleep were also in the top 3 most selected drivers.
Work, which was the 3rd most selected driver in March, moved to the 4th place in April, and was replaced by Weather.
Starting with the most selected drivers of form in April:
When selecting a score, the most selected driver was Energy, followed by Weather and Sleep.
Does this resonate with you? Does the weather make you feel more energetic?
And how has your sleep been recently? The data suggest that it has improved slightly, compared to March.
Drivers with the most impact on Form

Here, we look at the drivers with the biggest impact on our Form.
It will come as no surprise that Exercise is in the top spot, for the third consecutive month. It’s followed by Weather and Connections, for the second consecutive month.
This is a reminder that exercise and connections have the power to lift our form and and help us feel better. So next time you feel low, why not put your trainers on, spend time in nature, or reach out to a friend?
When it comes to drivers that had the most negative impact on our Form:
Stress management continues to have the most negative impact on our Form for the third consecutive month. This is followed by Work and Finances. However, it’s worth noting that Finances was logged only by a small number of Formsters.
When we look at the impact of the drivers logged in April, compared to those in March:
Exercise and Connections were also in the top 3 most selected drivers.
In March, Weather was the 4th driver with the most impact, but moved to the 2nd place in April, with a positive effect of +0.11.
When it comes to the biggest negative changes:
The top 3 drivers that had the most negative impact on our form in March were Stress, Travel and Finances. (Once again, it’s worth noting that Travel and Finances were the least selected drivers.)
Average score when selecting a Driver of Form
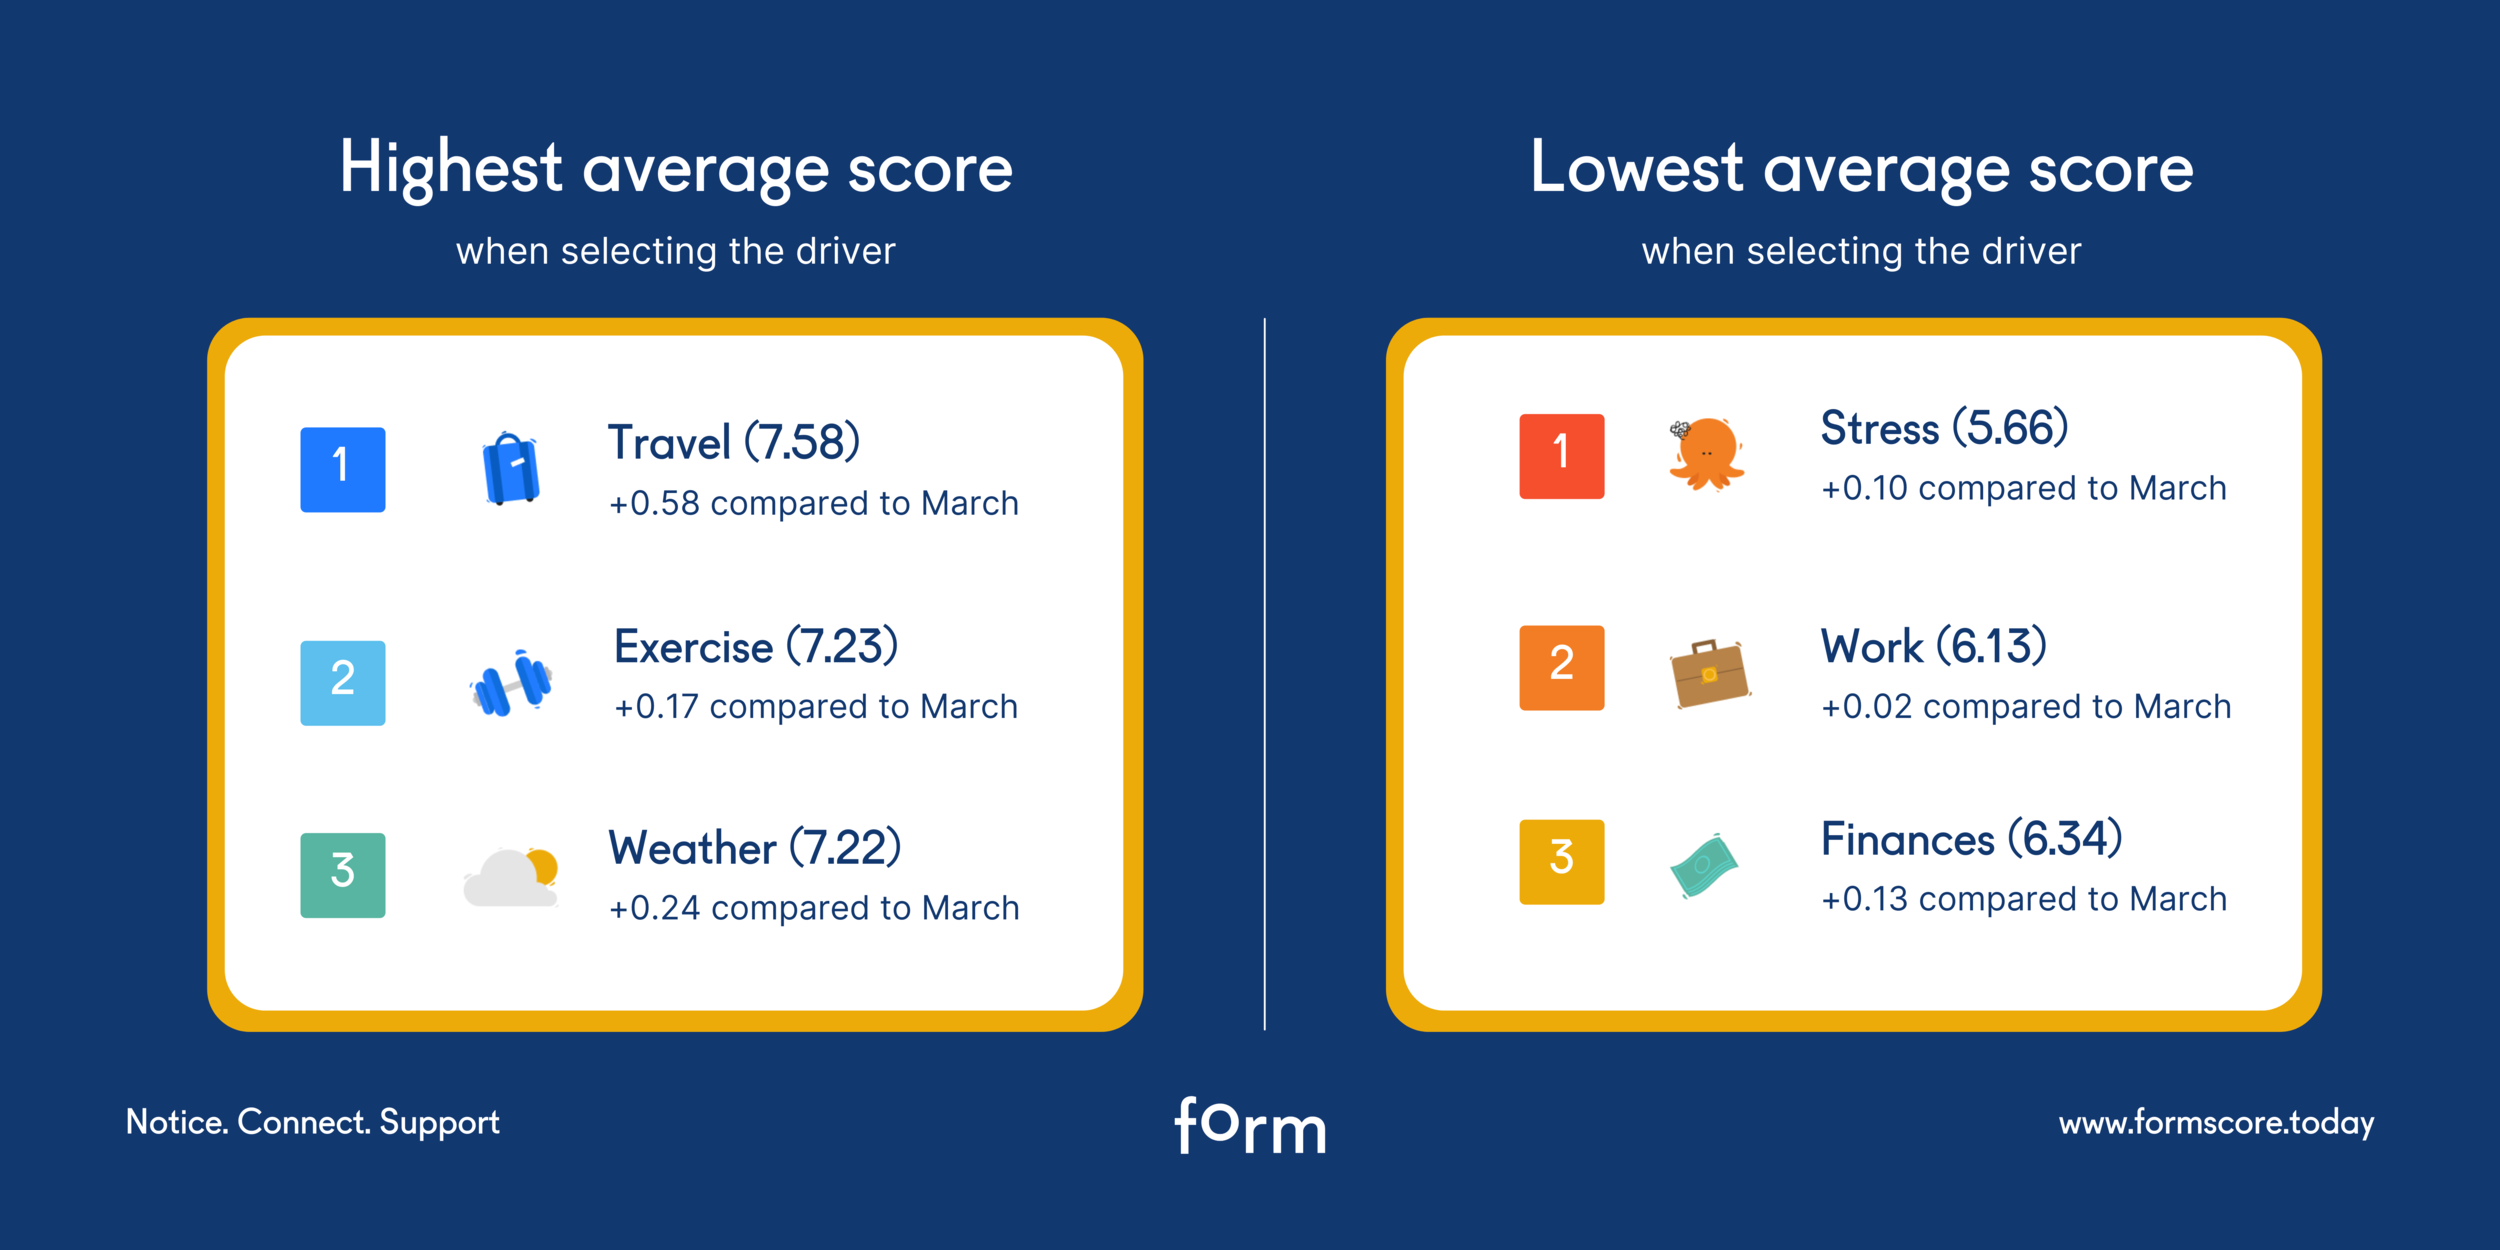
Here we see the average score selected when a driver of form was logged:
Travel was usually logged at an average of 7, followed by Exercise and Weather, which were also logged at an average of 7.
It’s worth noting that although travel was logged as the highest average score, it was the least selected driver.
With the weather improving, longer and warmer days also give us an opportunity to exercise outdoors and spend time in nature. These drivers, combined with future hope for travels, as lockdown restrictions ease, helped us maintain a high form.
Looking at the lowest average scores, Stress was logged the lowest overall, at an average of 5. When Work and Finances were the drivers of our form, they were logged at an average of 5.
Comparing the average scores logged for each driver in April, with those in March:
When Travel was selected, we saw an average of a 0.6 higher score compared to the score logged in March. This shows that we are hopeful about traveling again soon. However, it’s worth noting that Travel was logged by very few Formsters.
Weather and Energy were also logged higher in April compared to March.
It’s positive to see that the average score for all drivers saw an improvement compared to March.
Did you notice that overall, you were in better form in April?
Are you interested in building up a picture of what is driving your own Form? Head on the App Store or Google Play, search for FormScore and watch your drivers of form build up.
How are your people today?
Here is where it gets even more interesting: Seeing the drivers of form, the impact and influence they have on teams within organisations.
You get to observe which teams are on higher form, and how they perform. You also get to see the teams that struggle the most so that you can offer specific support.
You get a better understanding of whether work has a positive or negative impact on your people.
How satisfied are they in life.
How resilient they are.
How each age group experiences different form and is affected by different drivers.
The difference between genders and so much more…
We can’t wait to share this insight with your organisation!