
Drivers of Form - August 2021
Every month, we dedicate time to reflect on how the FormScore community feels, what the main drivers are, and think of ways to support you.
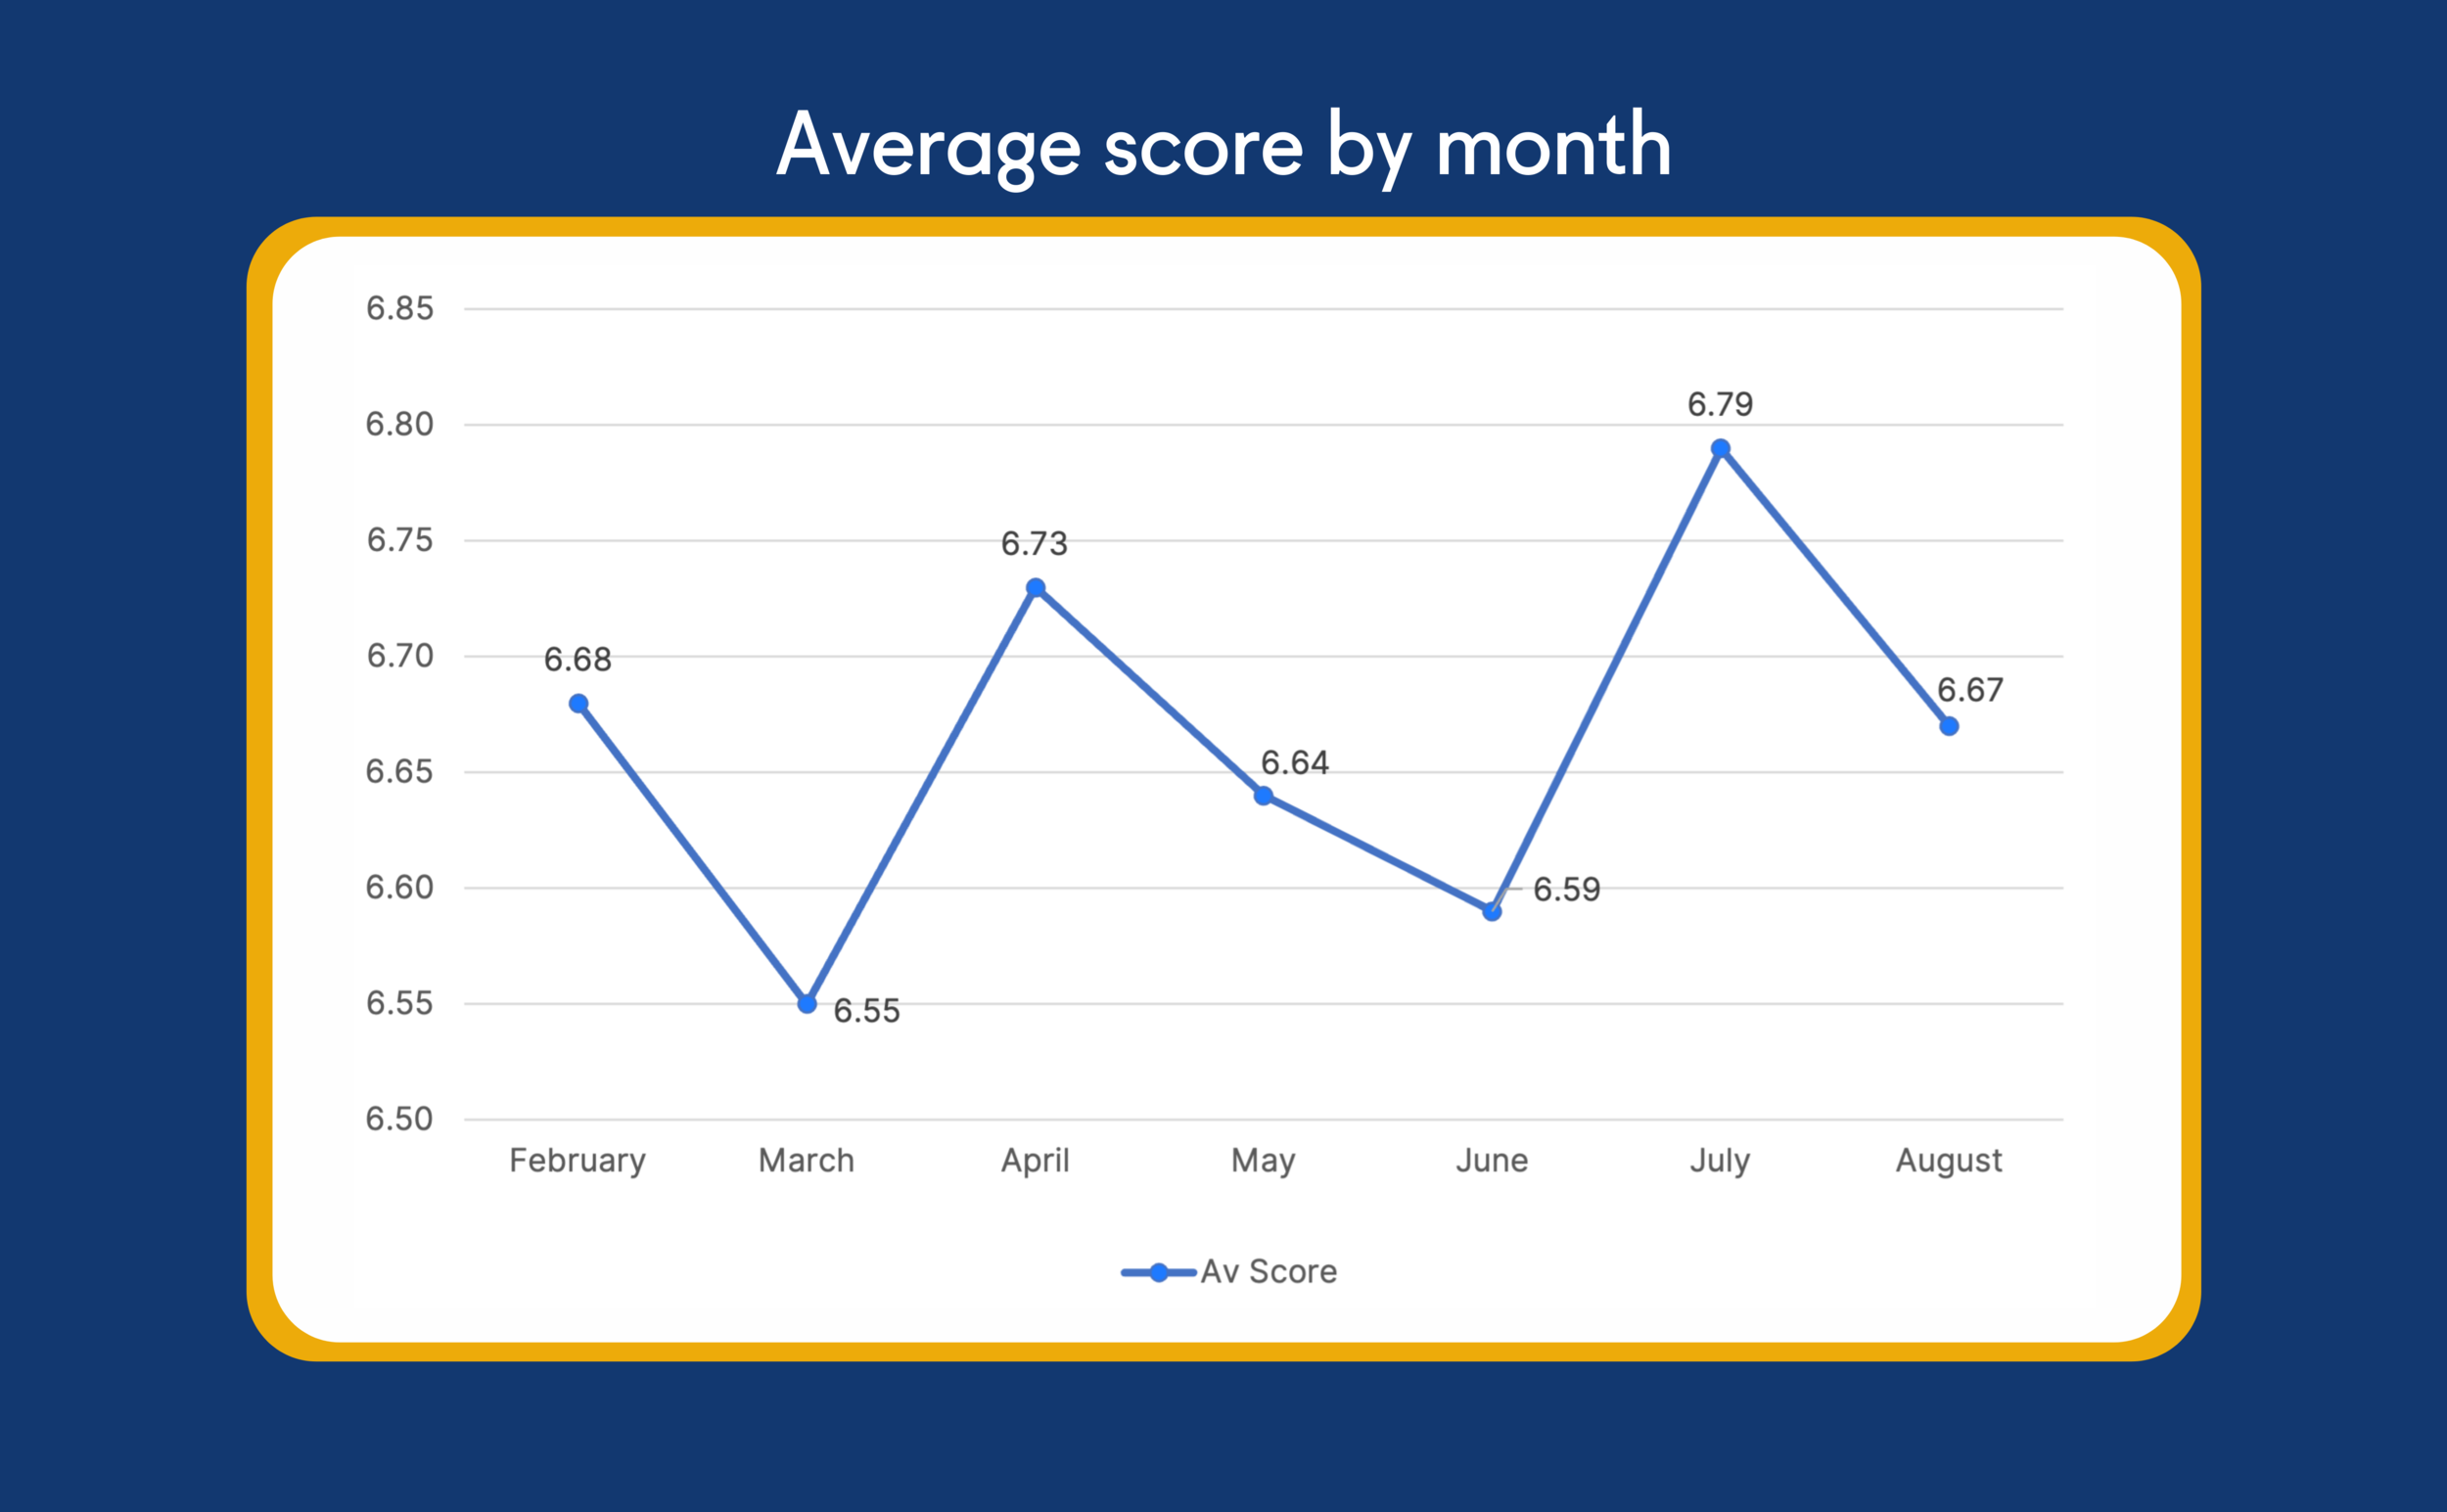
Here is what we observed in August:
The overall average score was 6.67.
The report below suggests that the average score is due to Travel and Exercise, which brought our form up.
It’s also due to Stress that brought our form down.
The data show that we make the most of the summer days by exercising and traveling, locally and aboard, for leisure or business.
Your Form in August
Most selected Drivers of Form

The most selected drivers of form in August were Energy, followed by Work and Sleep.
Does this resonate with you? How energetic or lethargic did you feel in August? And how has your sleep been recently? The data suggest that all 3 drivers were usually logged at an average of 6, which is average Form.
Drivers with the most impact on Form

Here, we look at the drivers with the biggest positive and negative trends, which is the direction of movement when the driver is selected.
Kids, Travel and Exercise were the top 3 drivers that had a positive impact on our form. This is a reminder that exercise and getting away from our usual routine and surroundings have the power to lift our form.
It’s worth noting that although Kids had the most positive impact on our form, it was the least selected driver.
The data show that Stress Management and Finances had the most negative impact on our Form.
Sleep (av score 6.68) and Work (av score 6.50) were in the list of drivers that affected the vast majority of Formsters. When logged, they both had a positive direction of movement of +0.03. Although the change is so small, it’s almost insignificant, it’s good to see that they had a positive impact on our form. Usually Sleep and Work are in the top 3 drivers that cause a negative change on our form.
Average score when selecting a Driver of Form
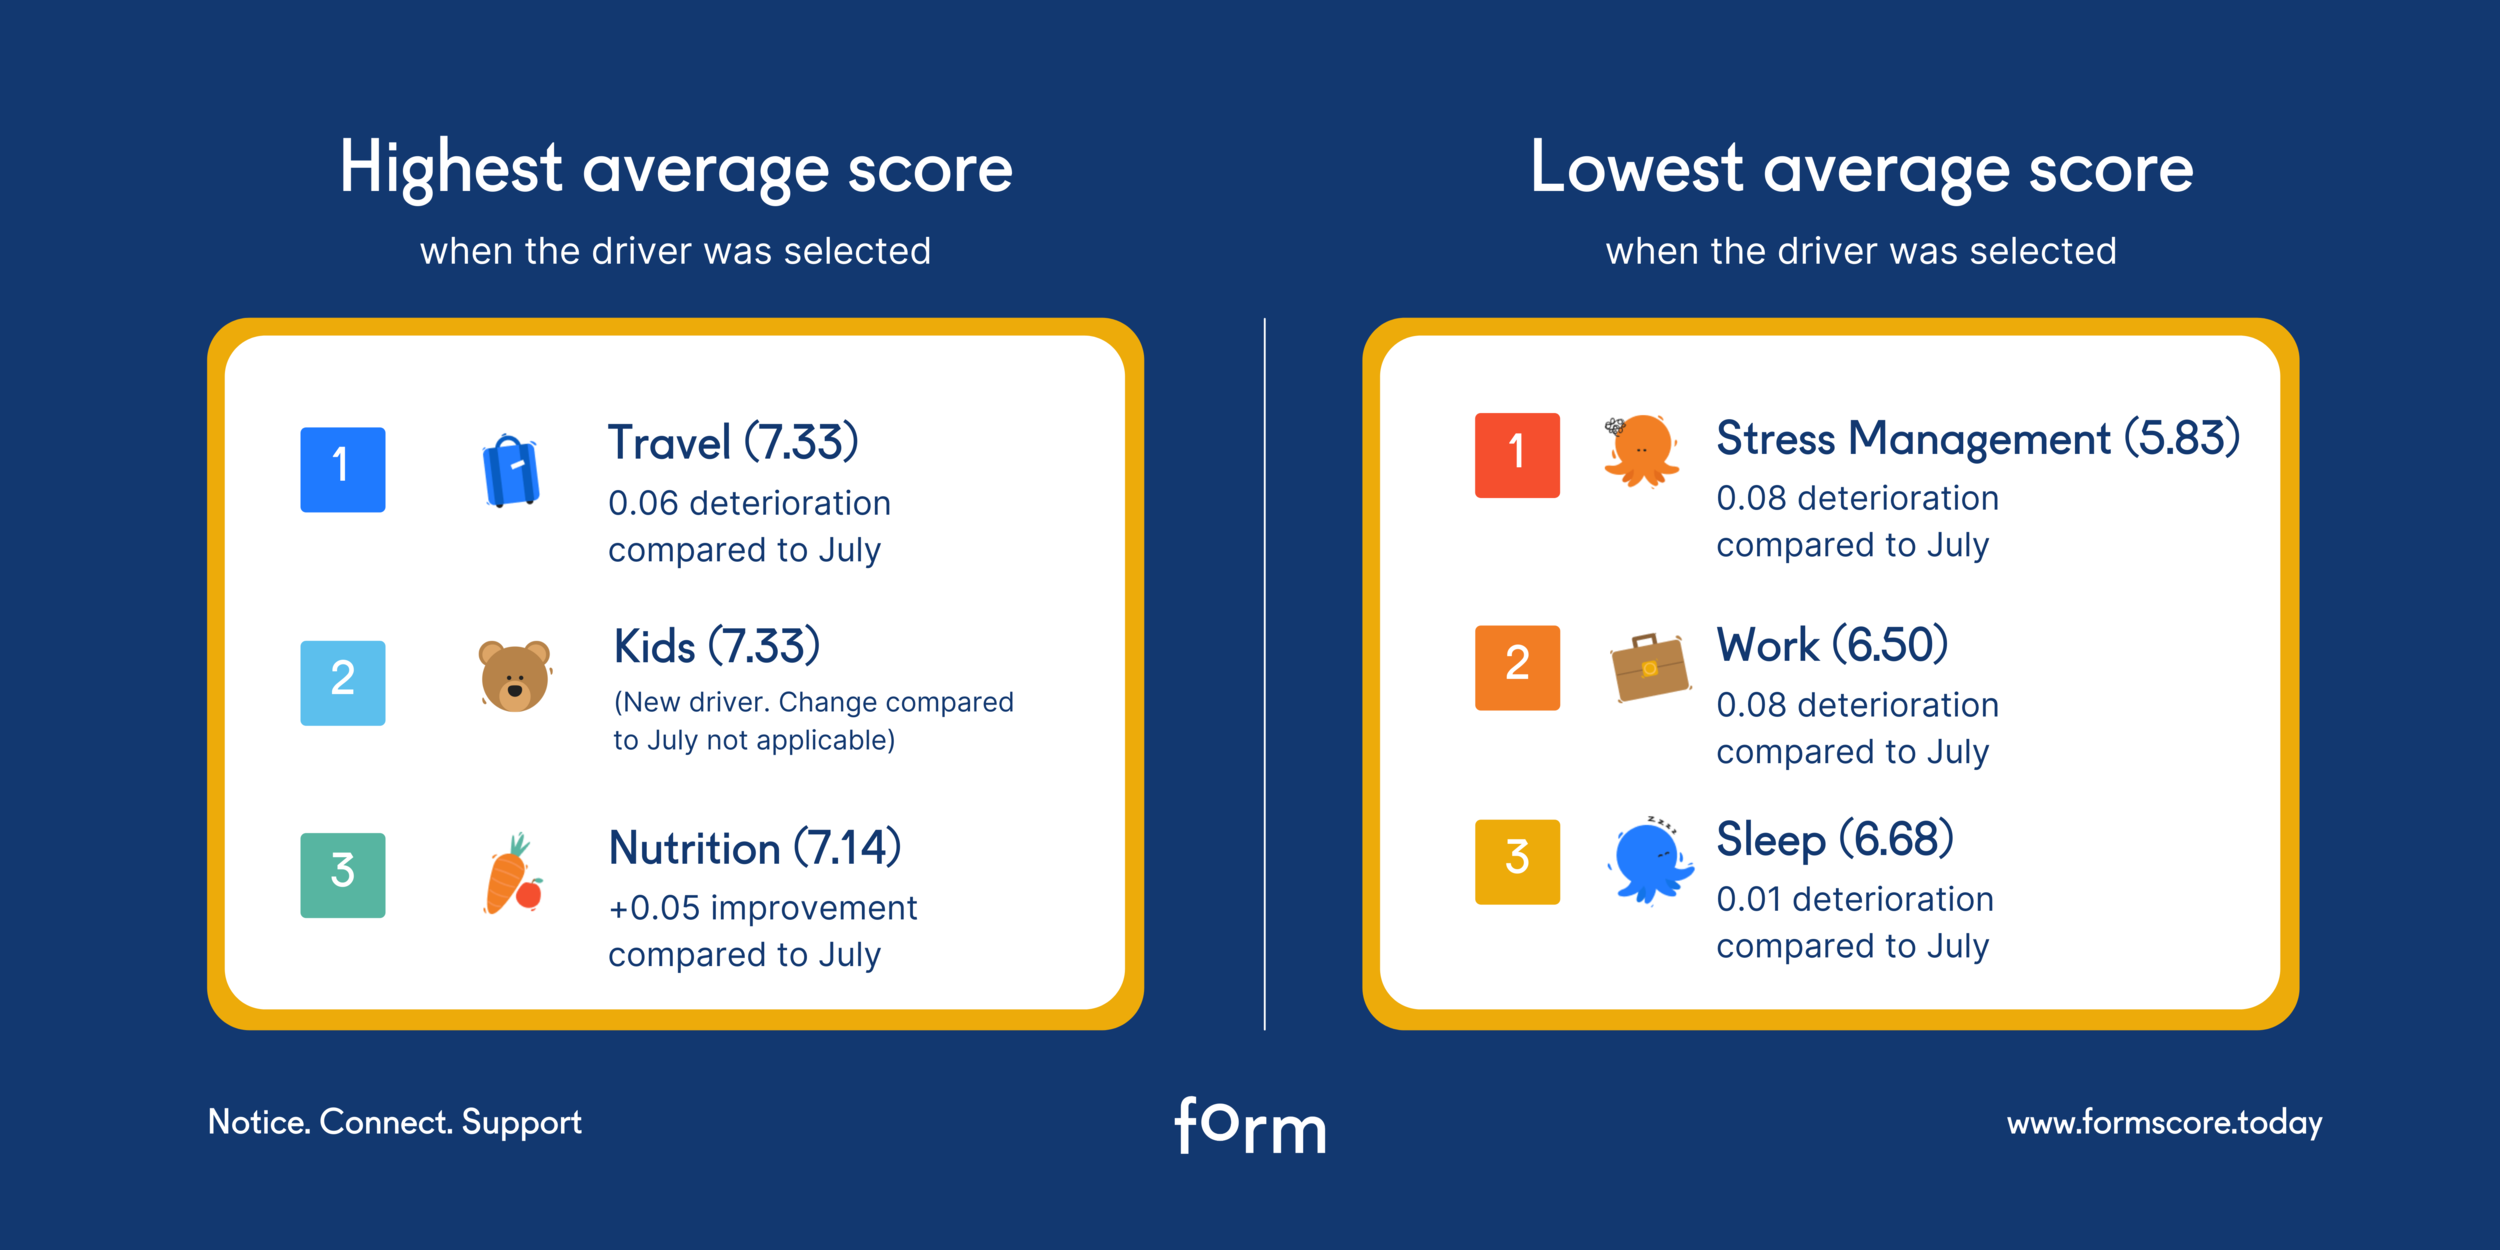
Here we see the average score selected when a driver of form was logged:
Travel, Kids and Nutrition were all logged at an average of 7. It’s worth noting that Kids was the least selected of all FormScore drivers.
Stress was logged the lowest overall, at an average of 5, followed by Work and Sleep, which were logged at an average of 6.
Are you interested in building up a picture of what is driving your own Form? Head on the App Store or Google Play, search for FormScore and watch your drivers of form build up.
How are your people today?
Here is where it gets even more interesting: Seeing the drivers of form, the impact and influence they have on teams and the wider business.
You get to observe which teams are on higher form, and how they perform. You also get to see the teams that struggle the most so that you can offer specific support.
You get a better understanding of whether work has a positive or negative impact on your people.
How satisfied are they in life.
How resilient they are.
How each age group experiences different form and is affected by different drivers, the difference between genders and and so much more…
We can’t wait to share this insight with your organisation!
We have built a game-changing evolution of the FormScore app for the workplace. Access will empower you and your employees with real-time insights on how their team, and wider business, feels. Insights include current overall average score, score distribution, trends, team usage, data visualisation and engagement.
Here is a visualisation of how the wider FormScore community felt in a month. Each line represents a Formster’s journey, each dot their score.
You are an email away from having access to these insights for your organisation.
