
Interpreting the results
Now that your team members have recorded their score, you’re ready to check the results.
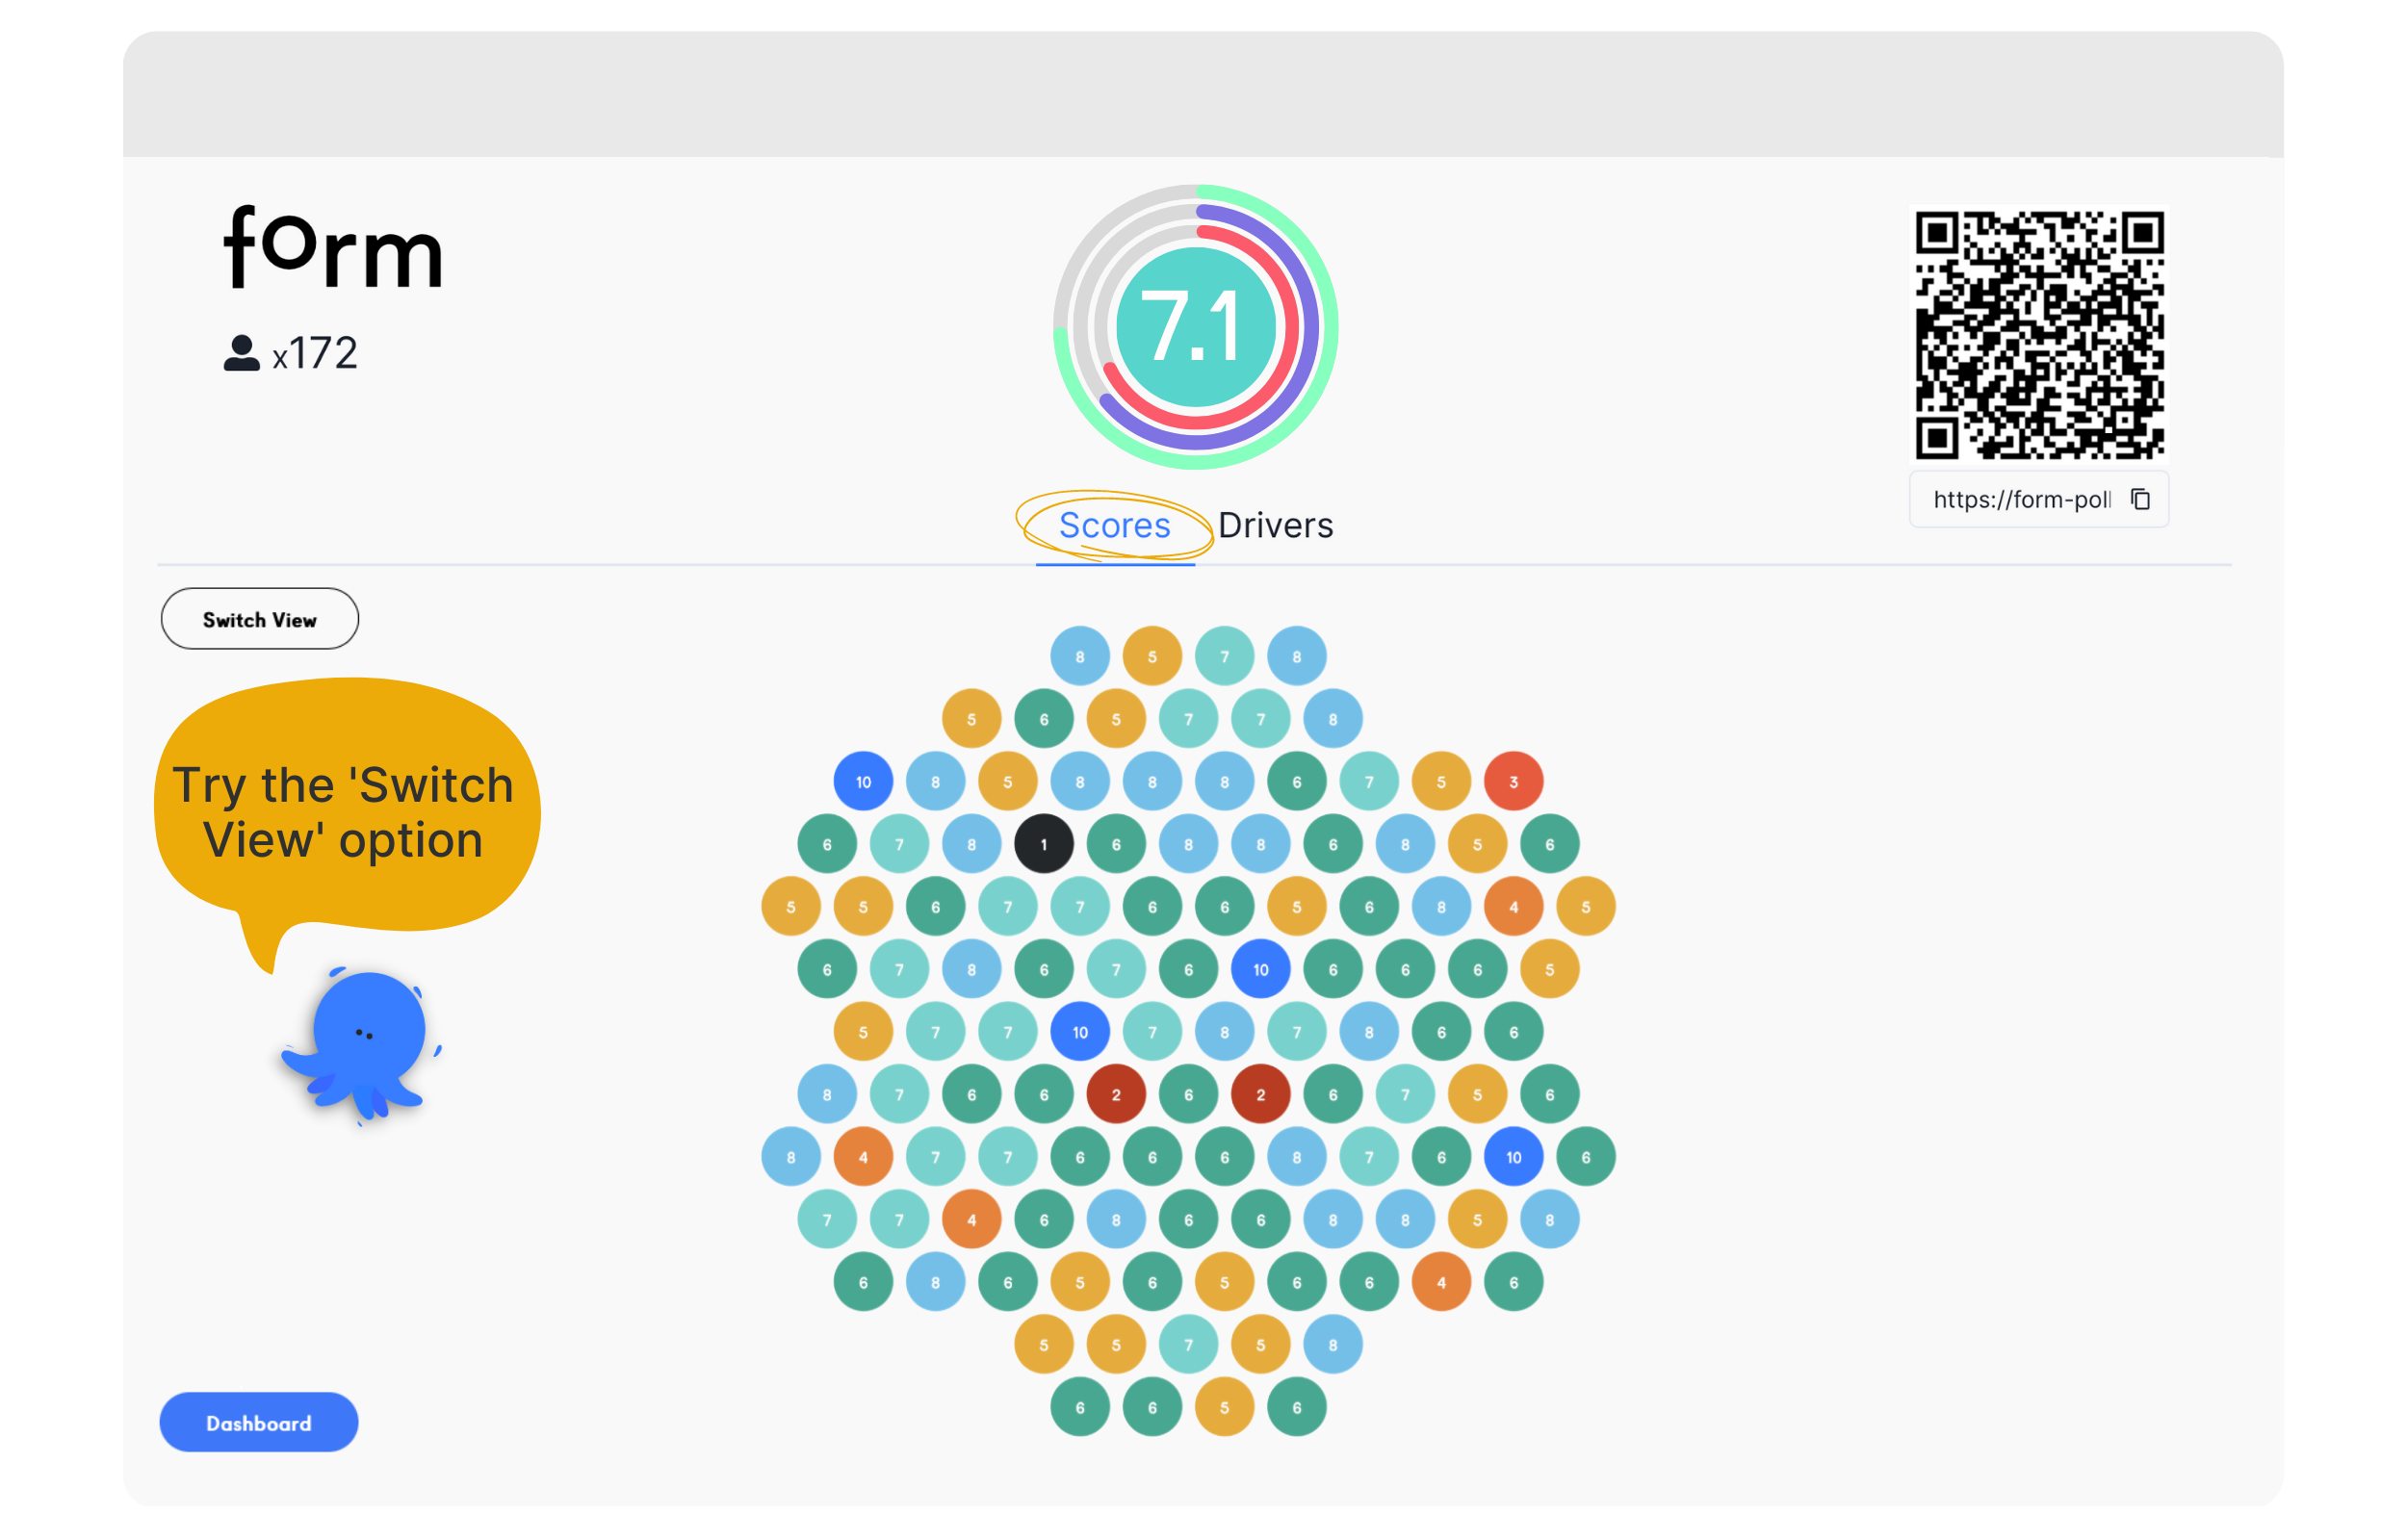
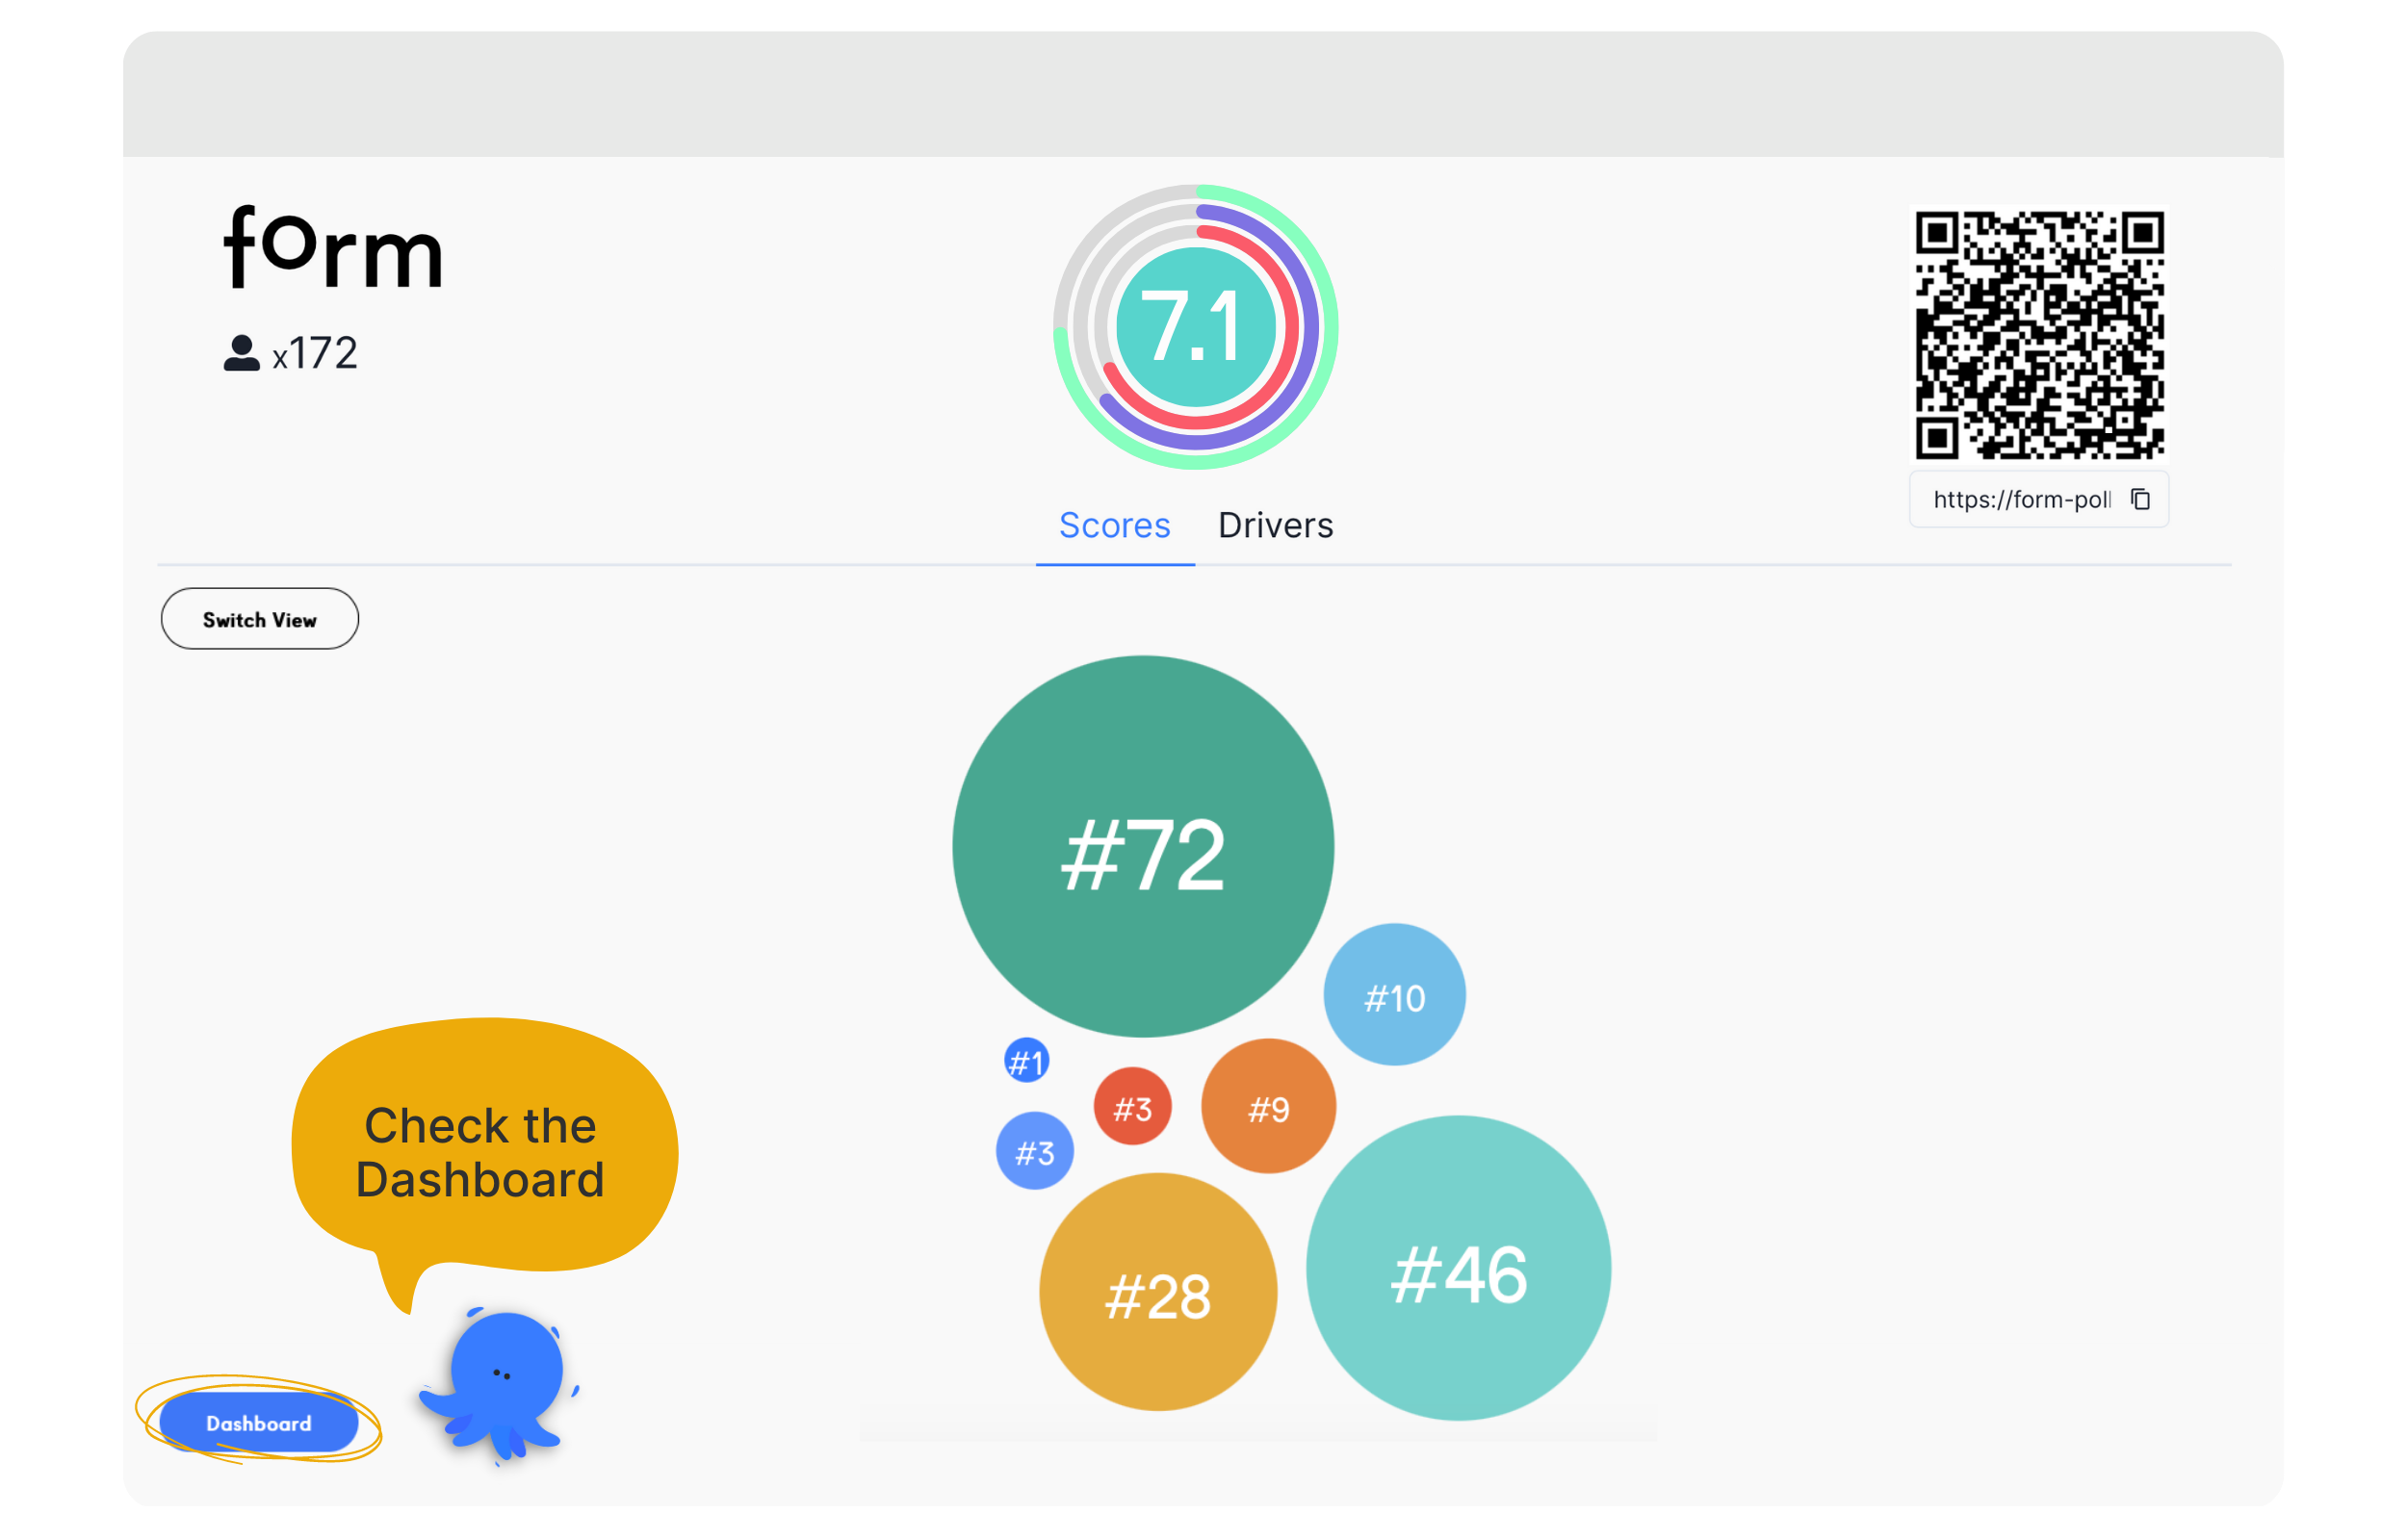
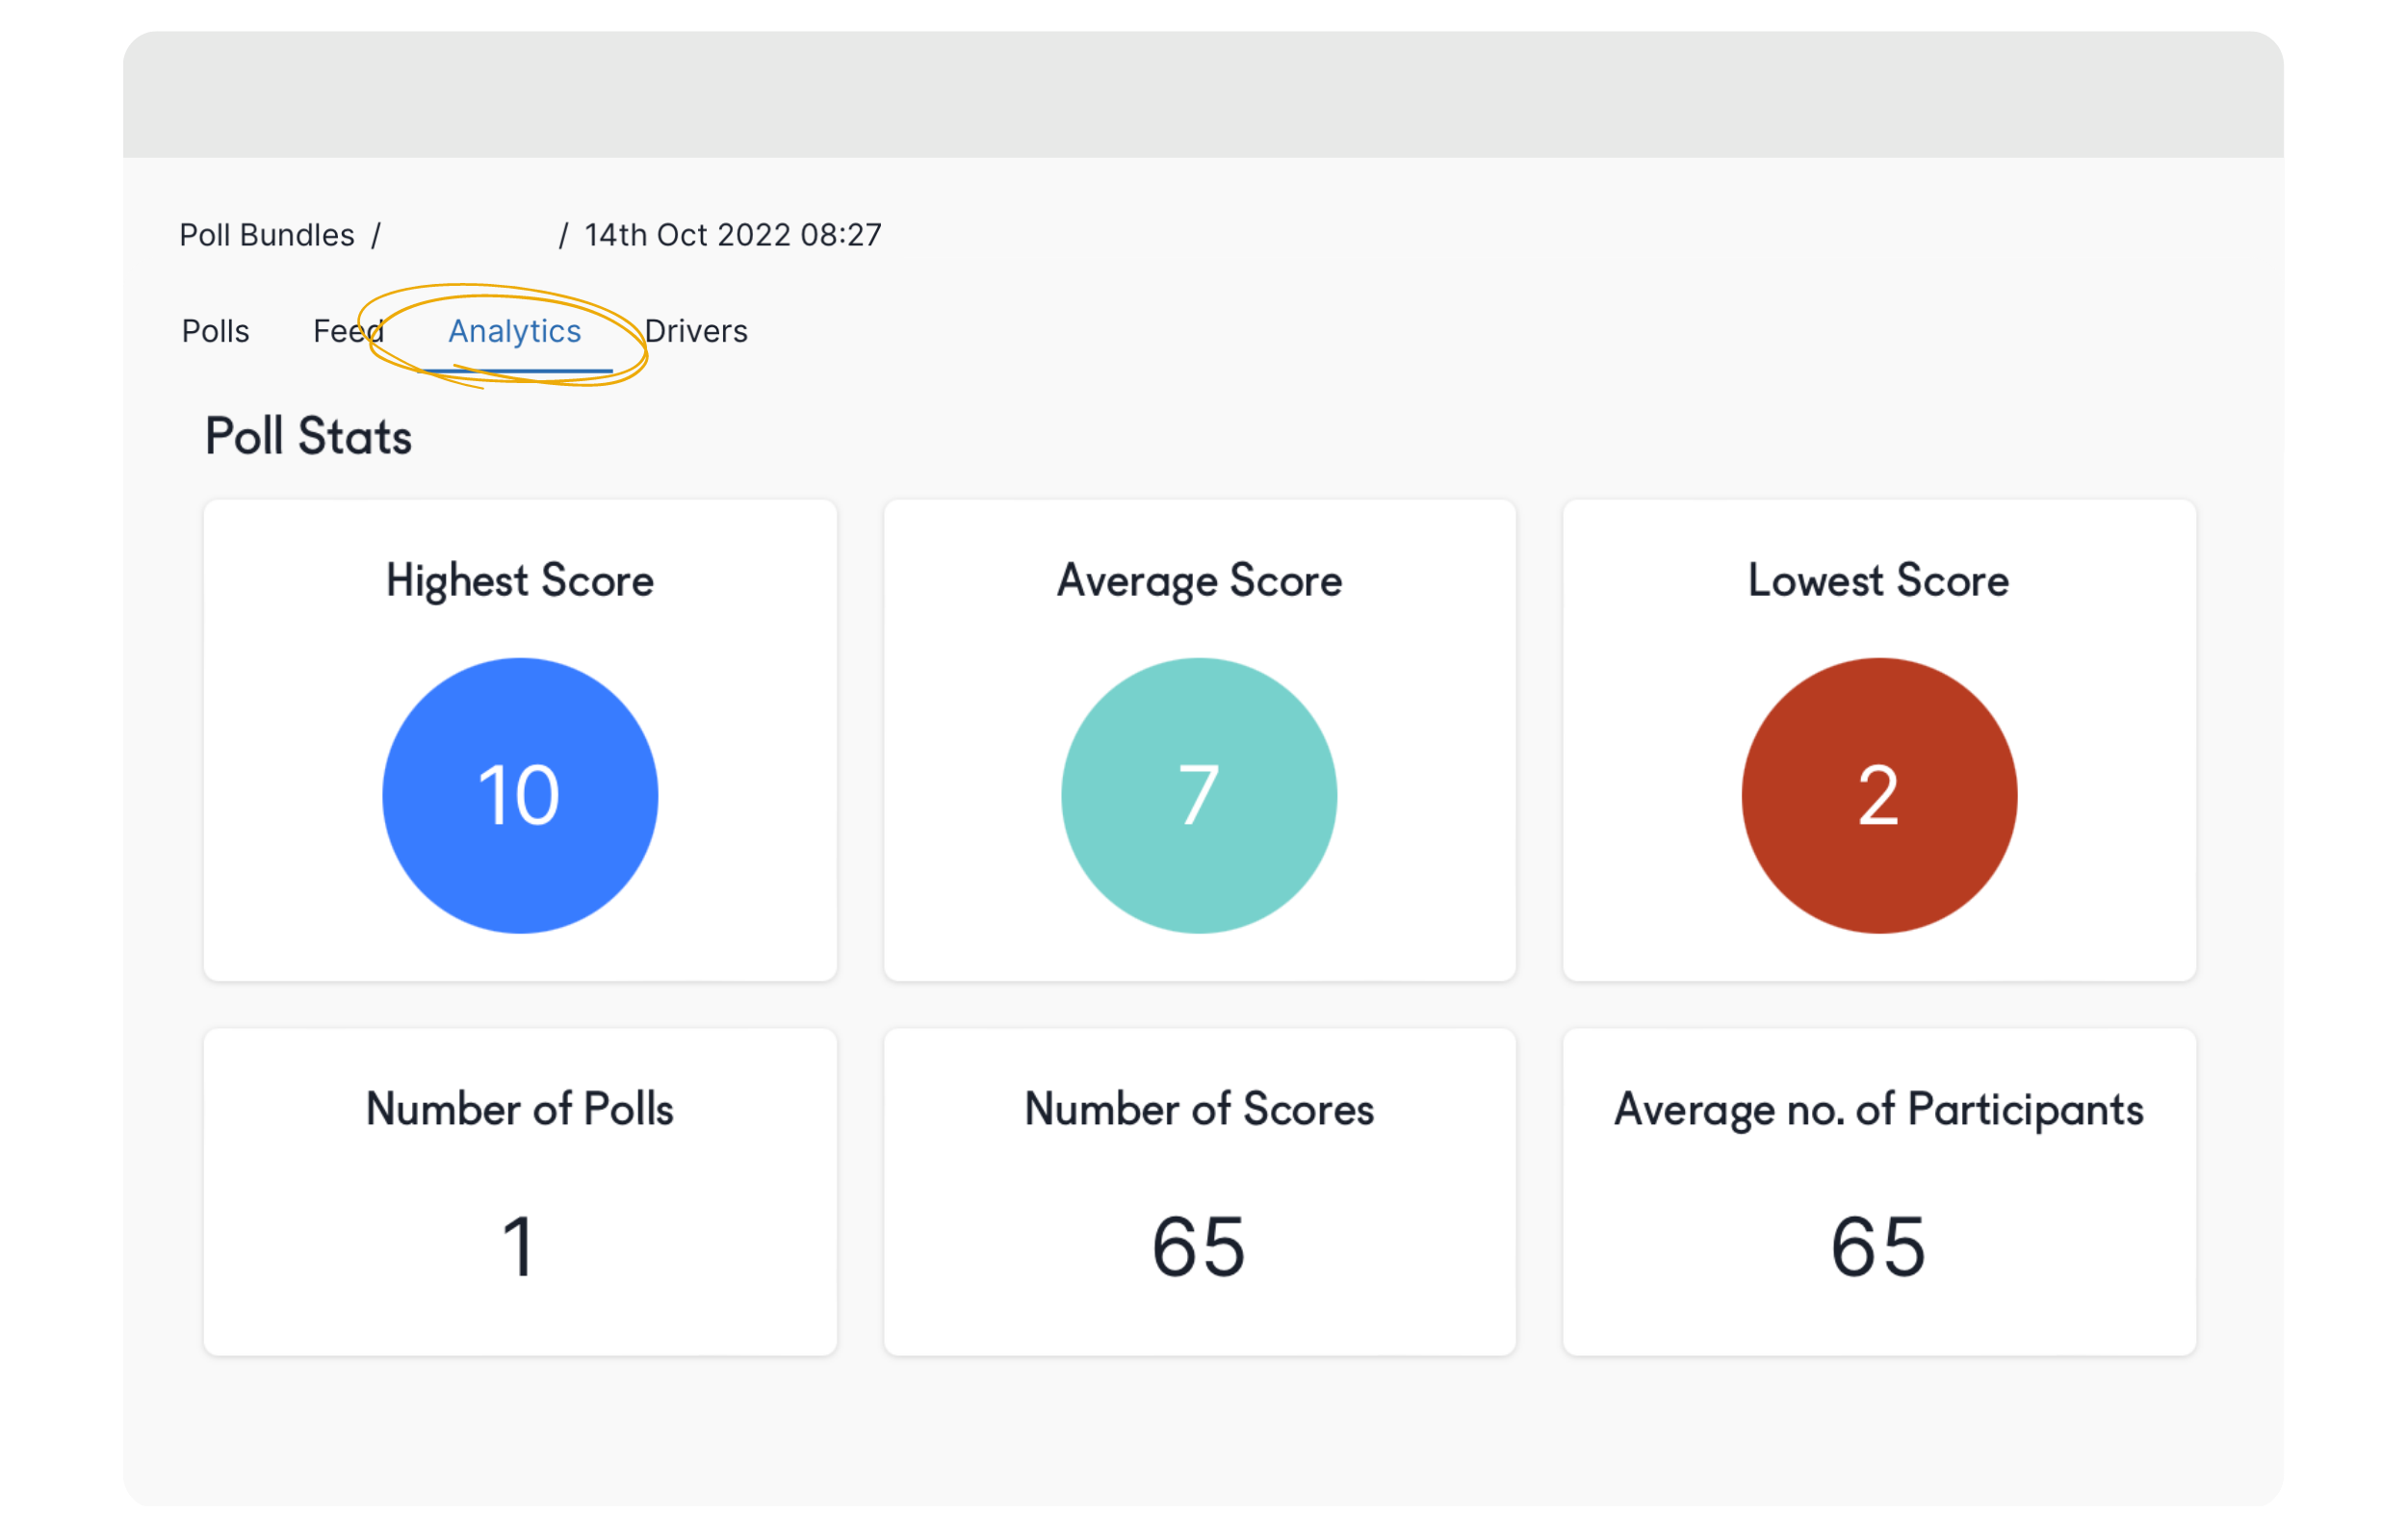
Within the Scores menu/tab, click on the 'Switch View' feature on the left to see the score distribution summary.
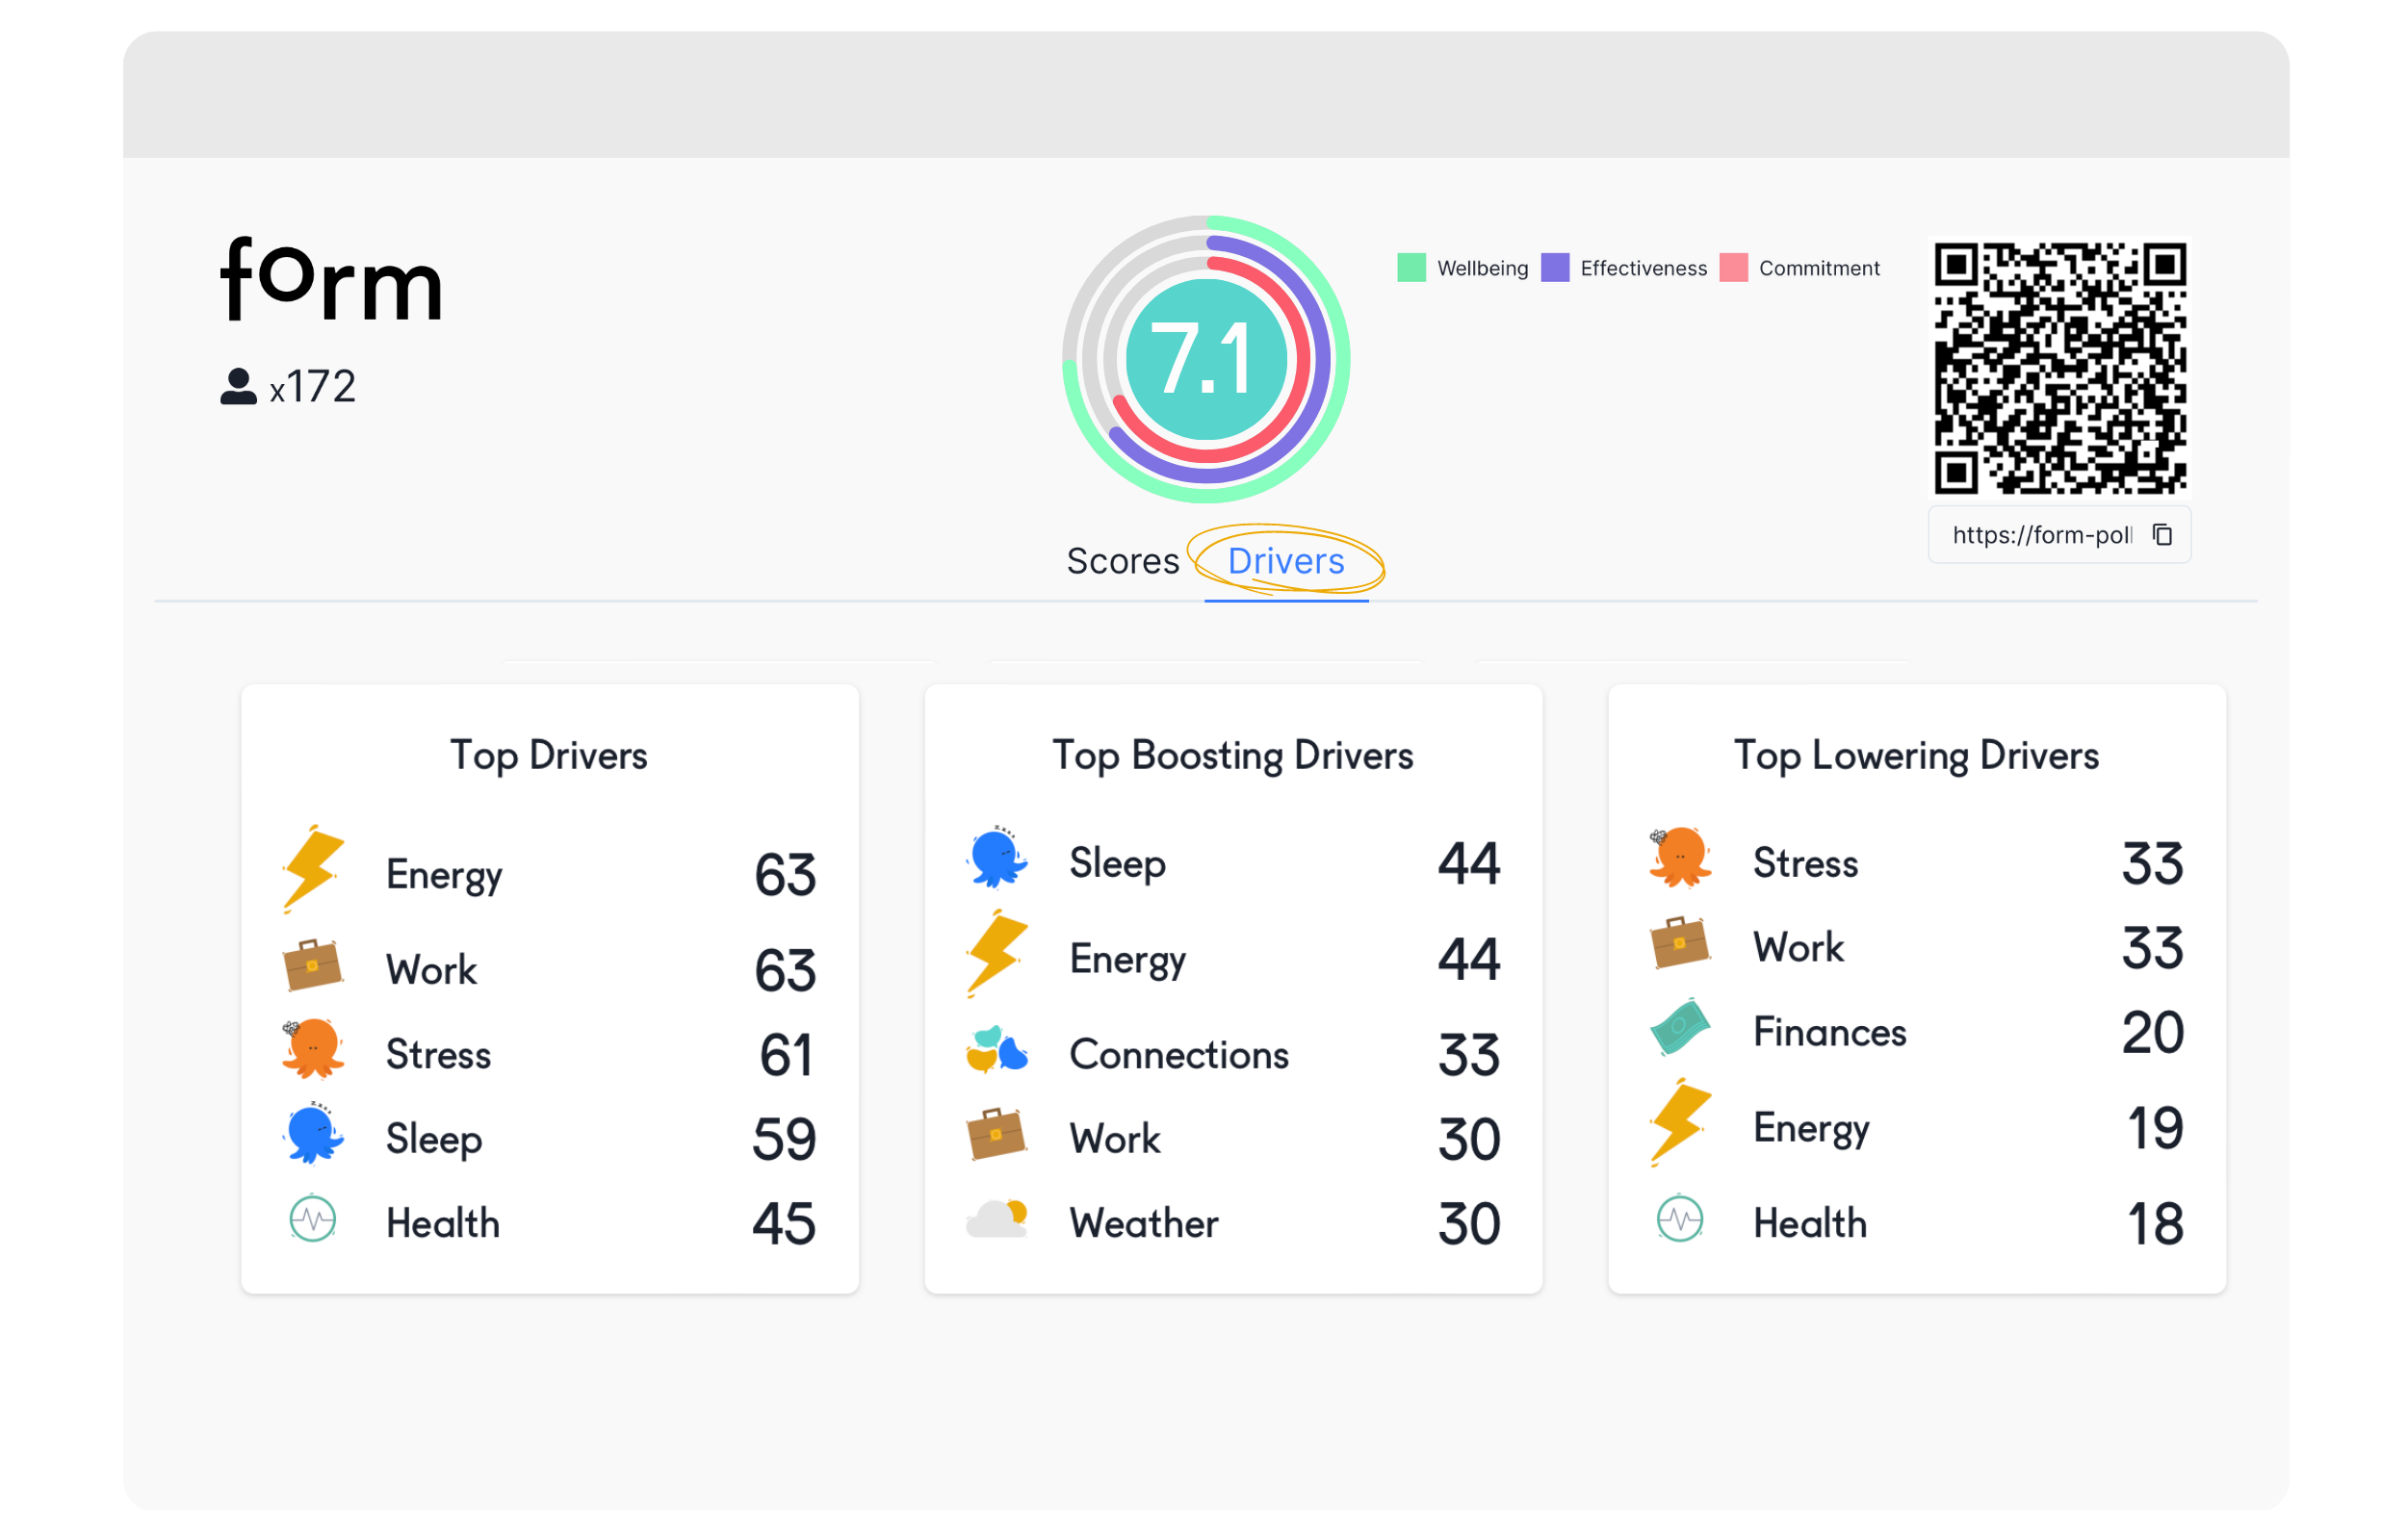
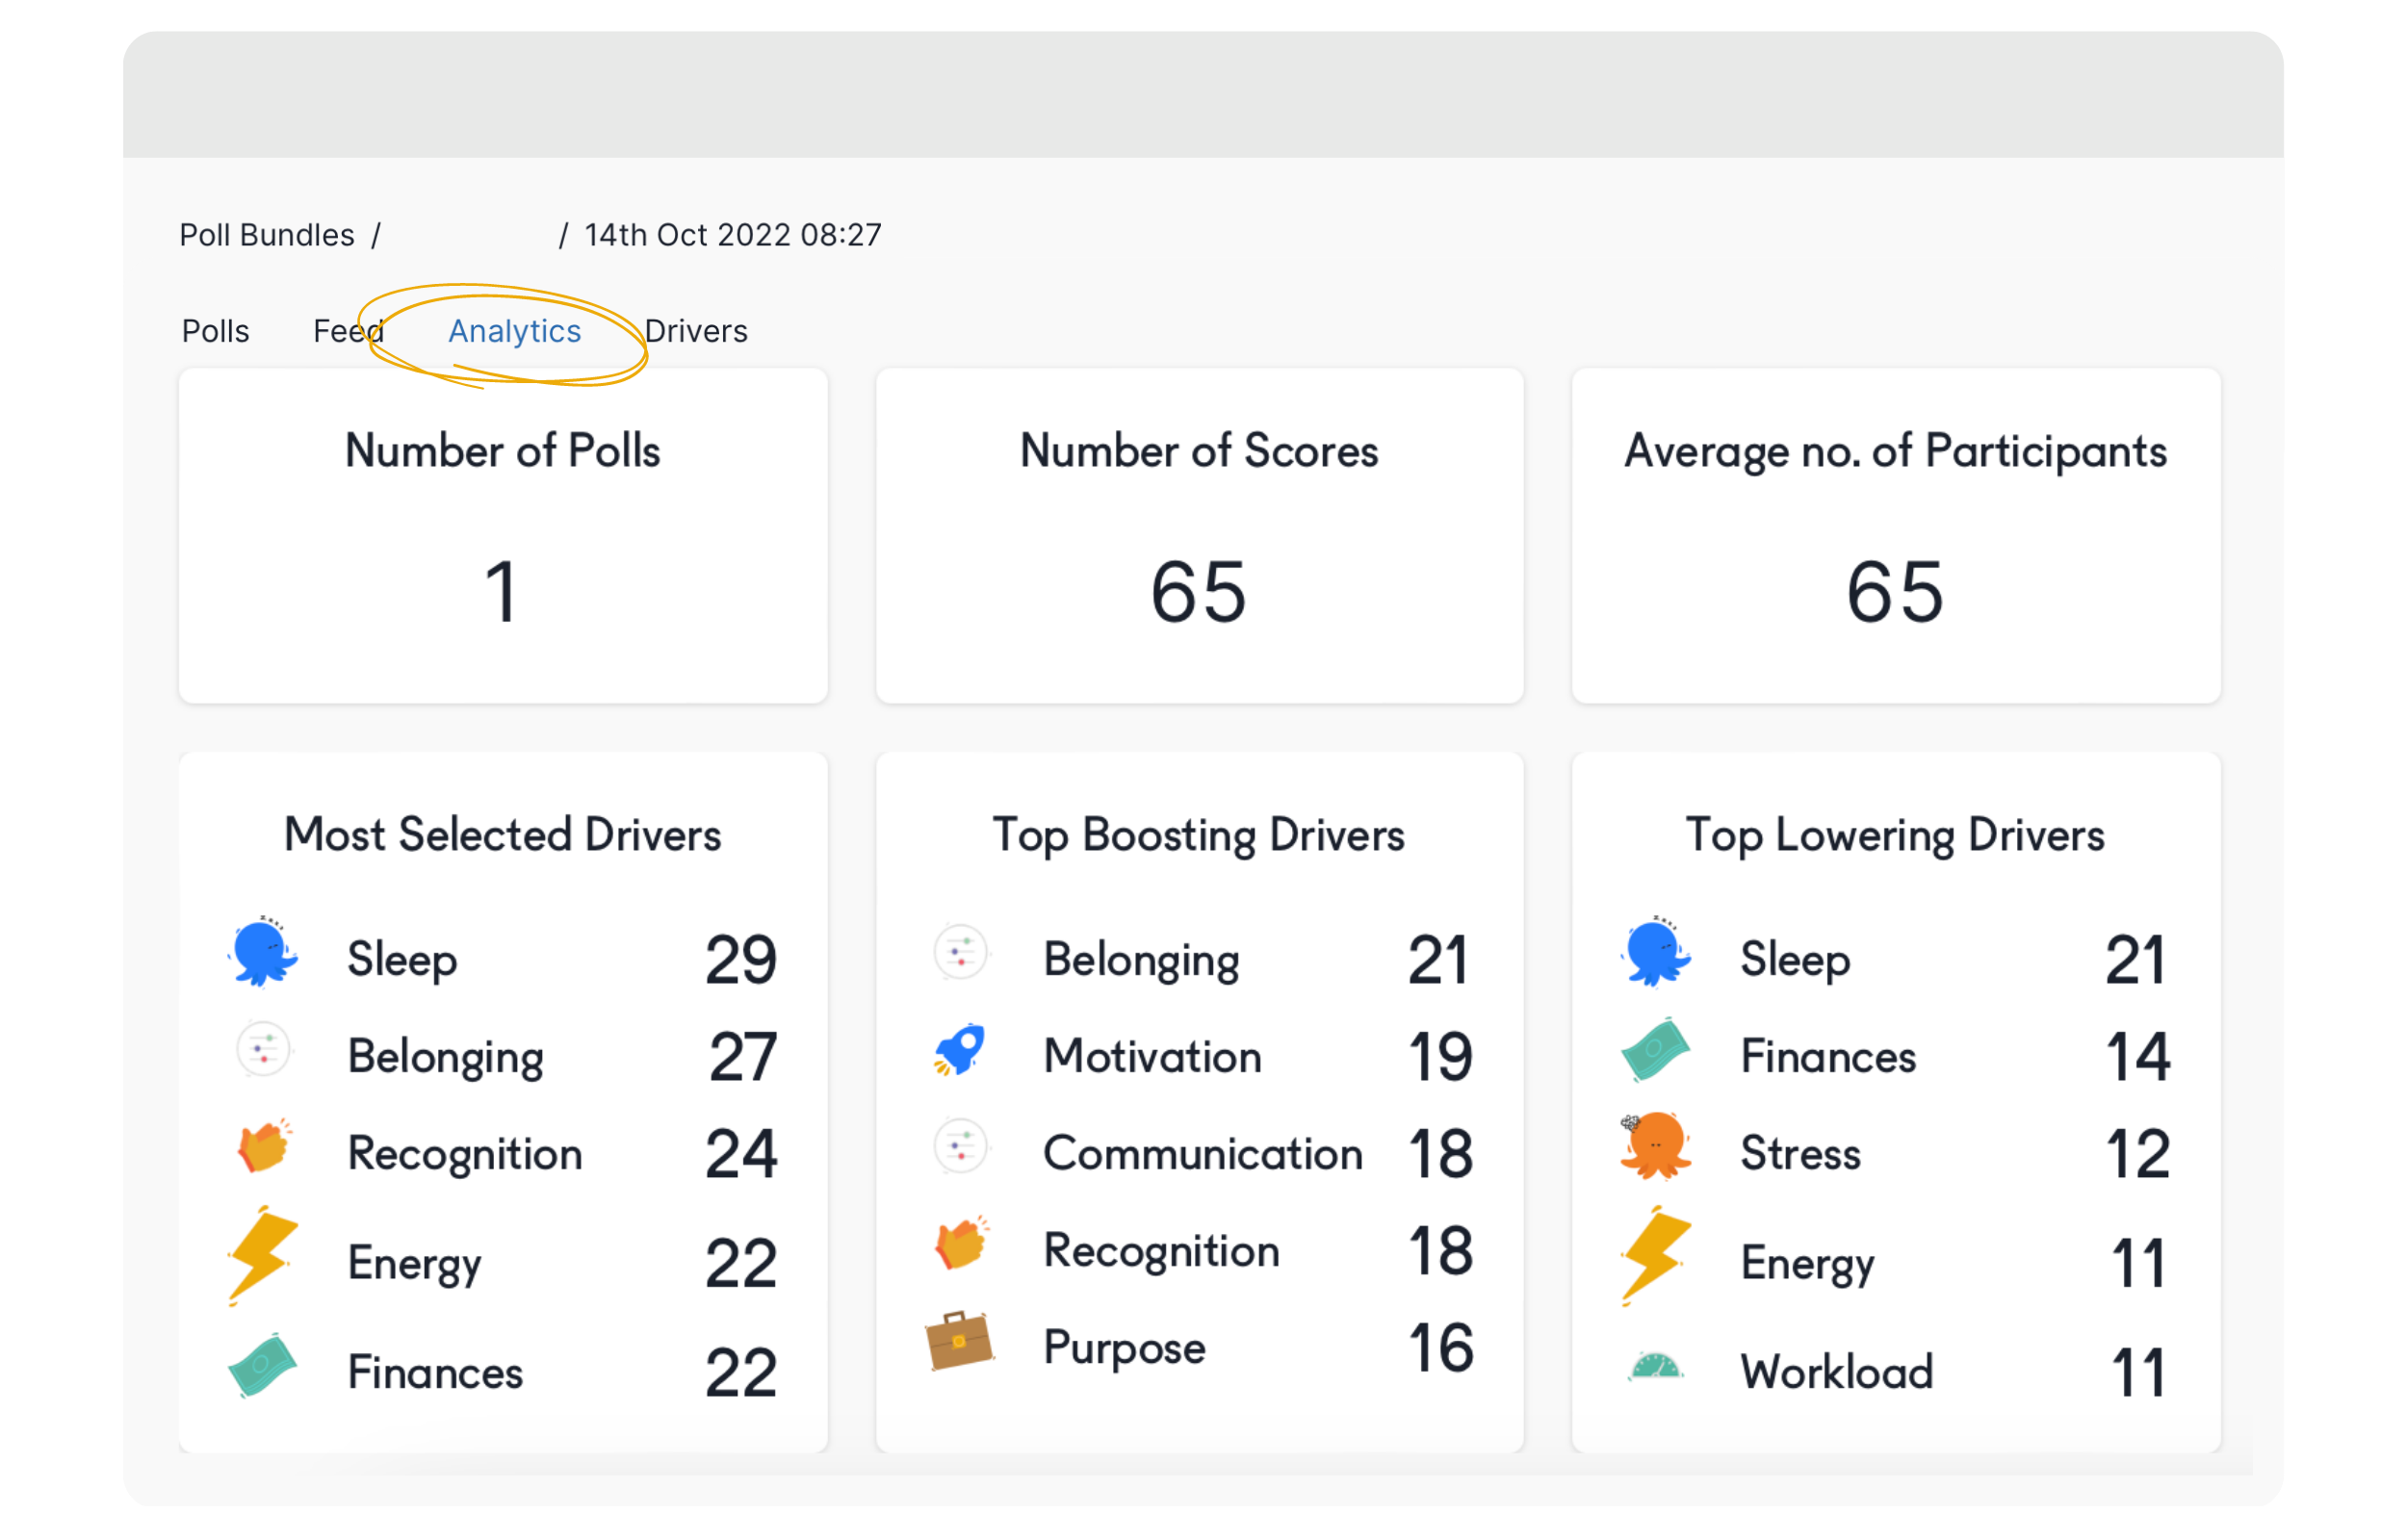
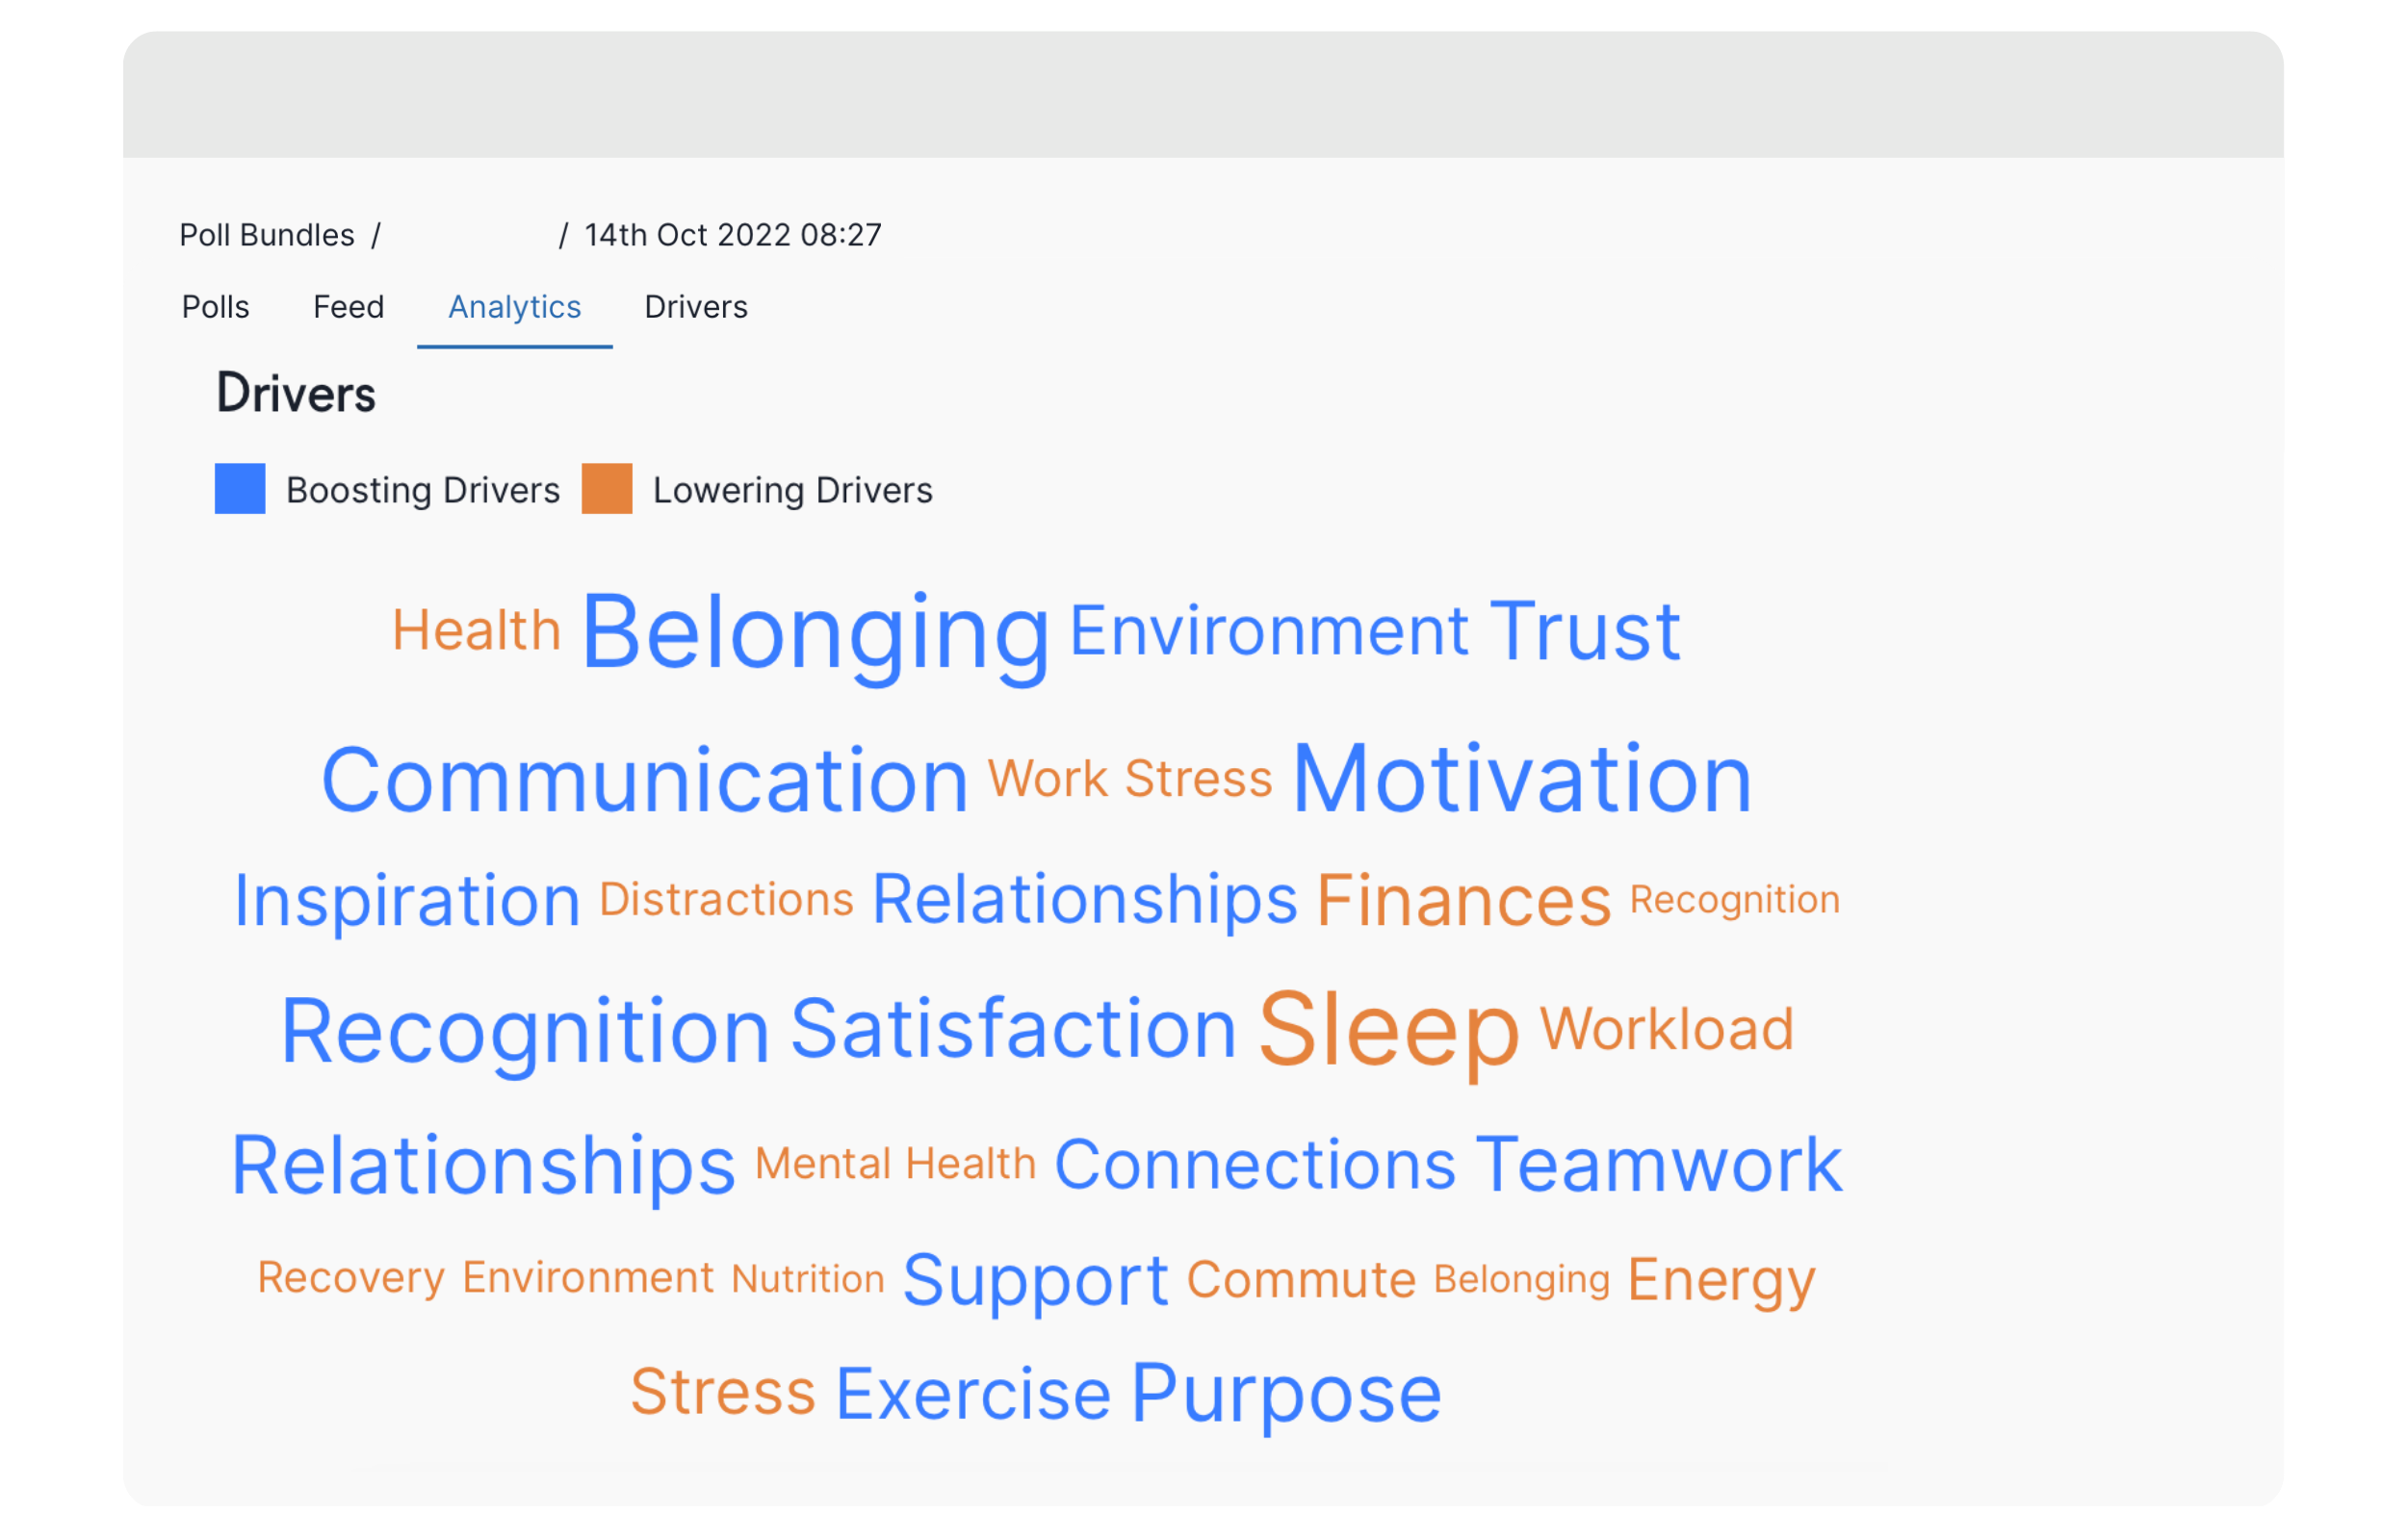
Navigate to the Drivers menu/tab to see:
Top Drivers: The most selected drivers
Top Boosting Drivers: the factors that boost the team’s form the most
Top Lowering Drivers: the factors that lower the team’s form the most
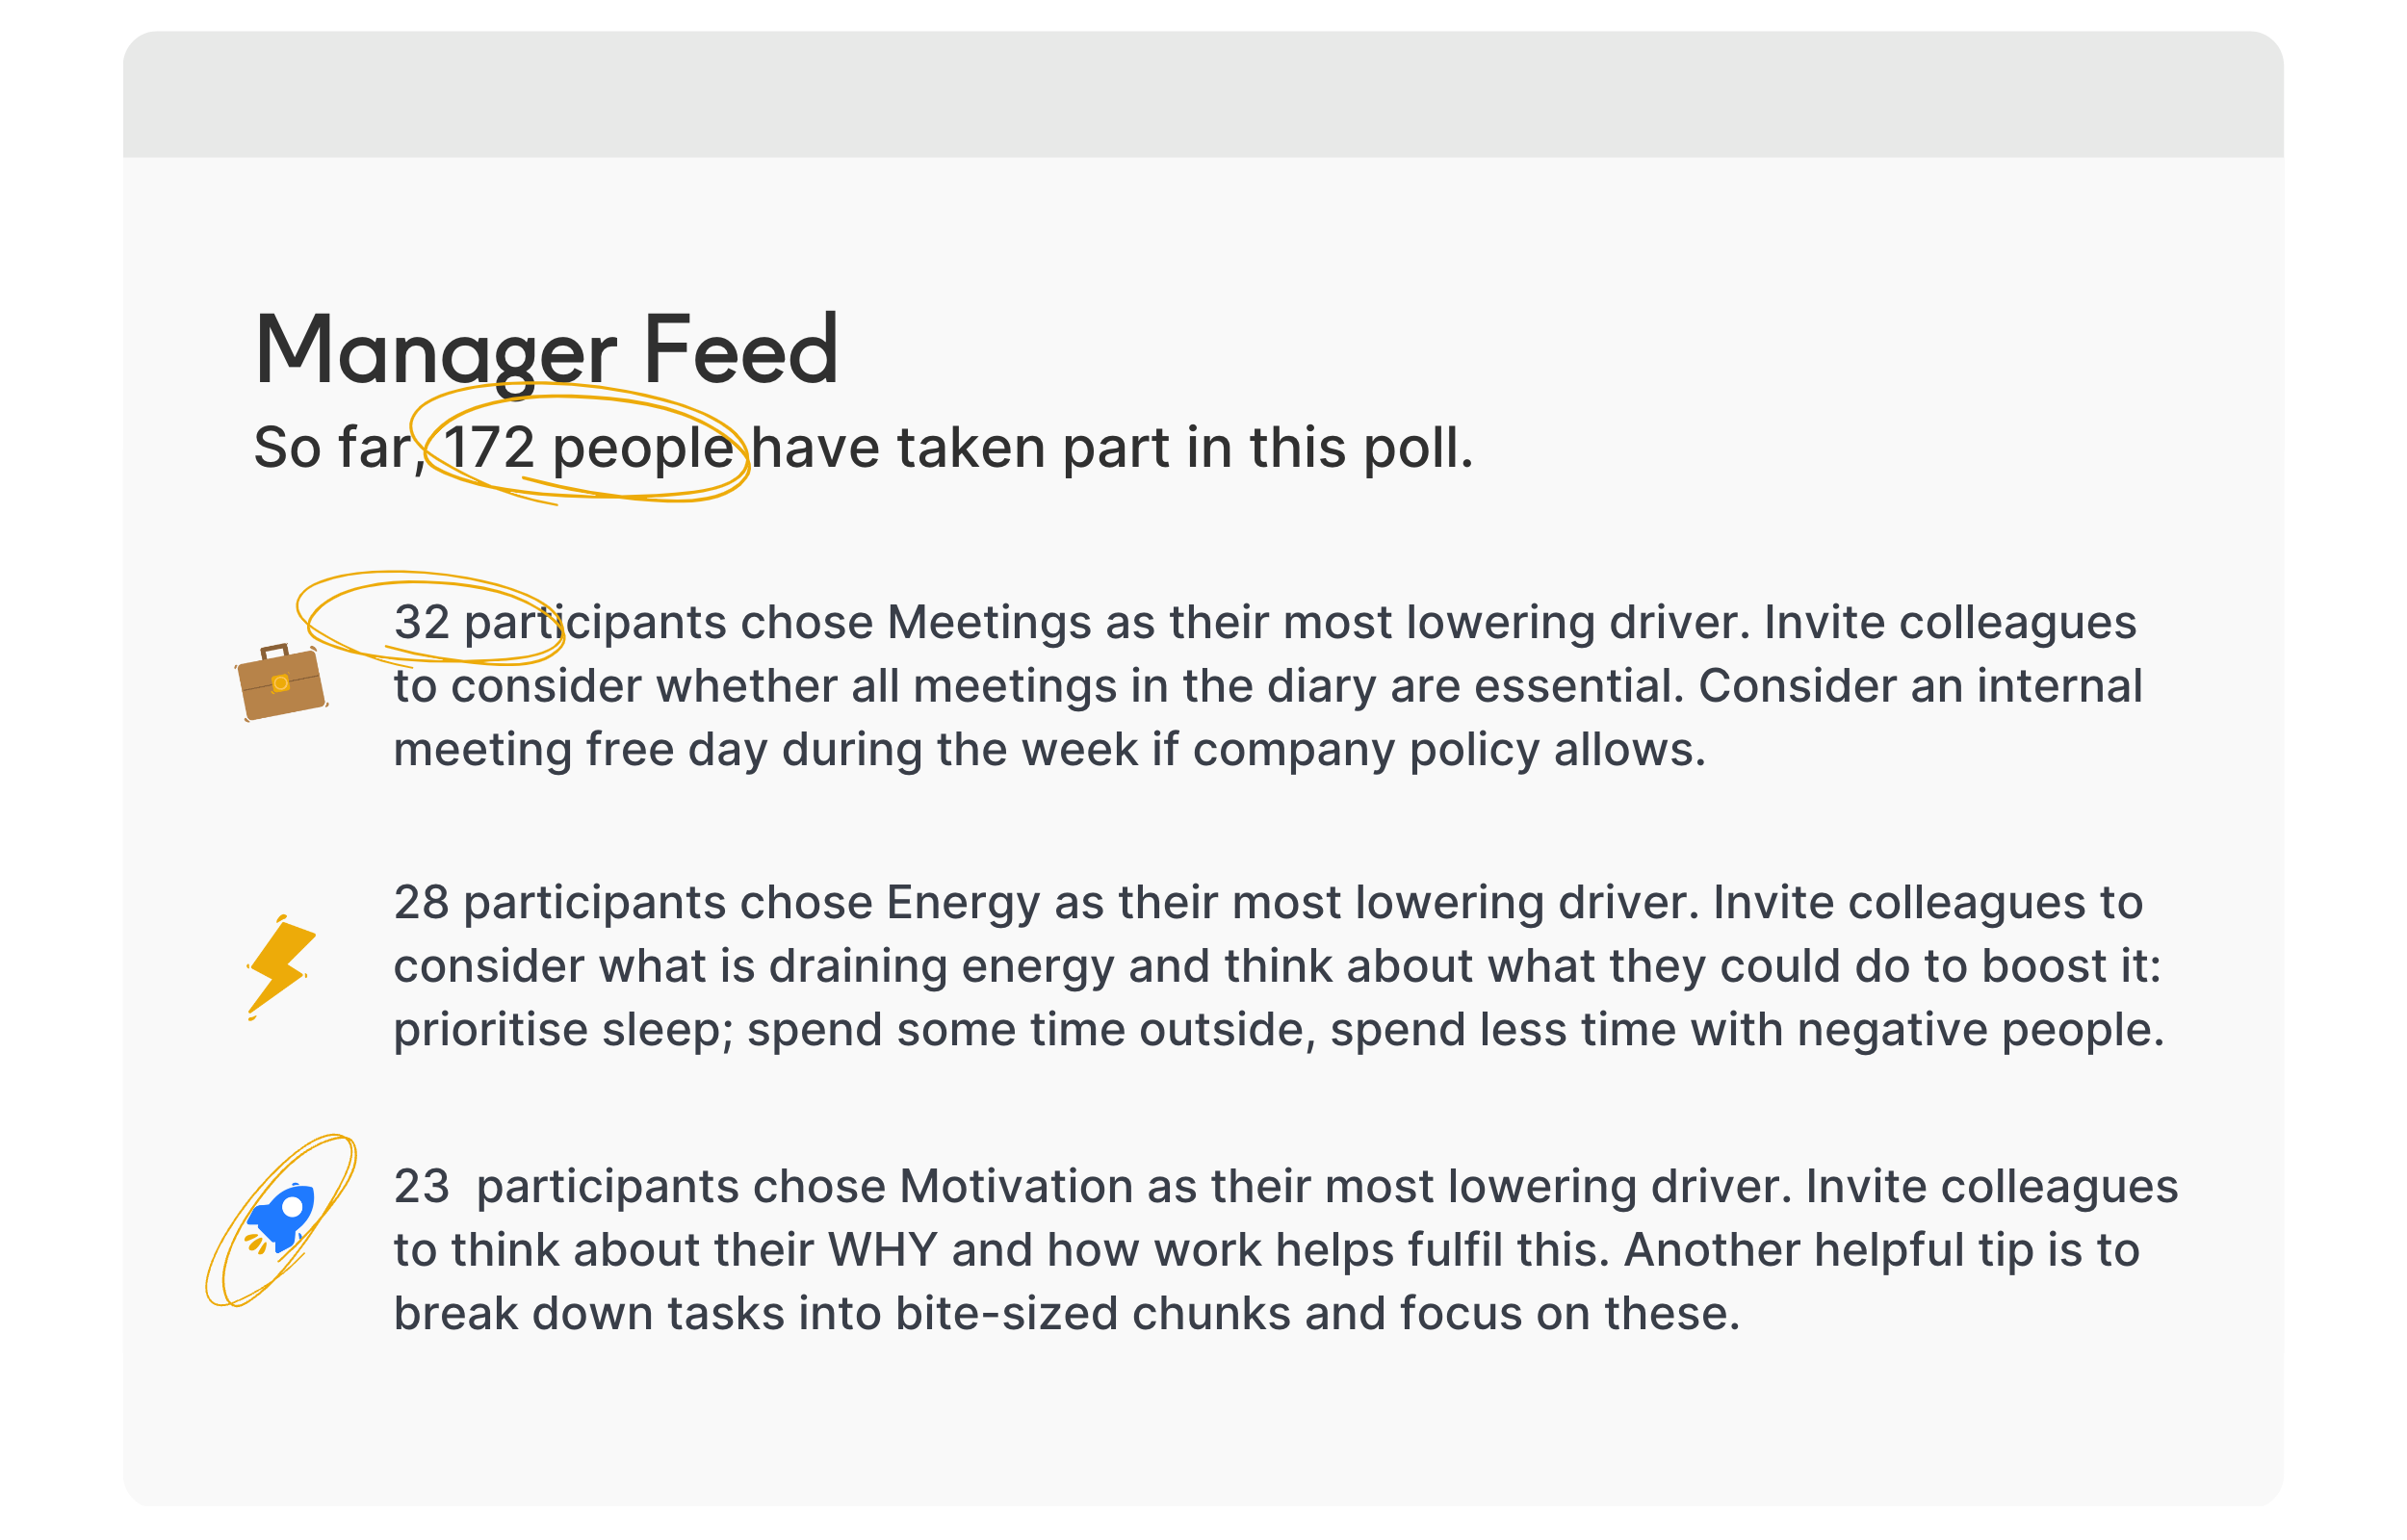
Click on the Dashboard button and check the Feed to view personalised suggestions on how to respond to the drivers of form recorded by your team.
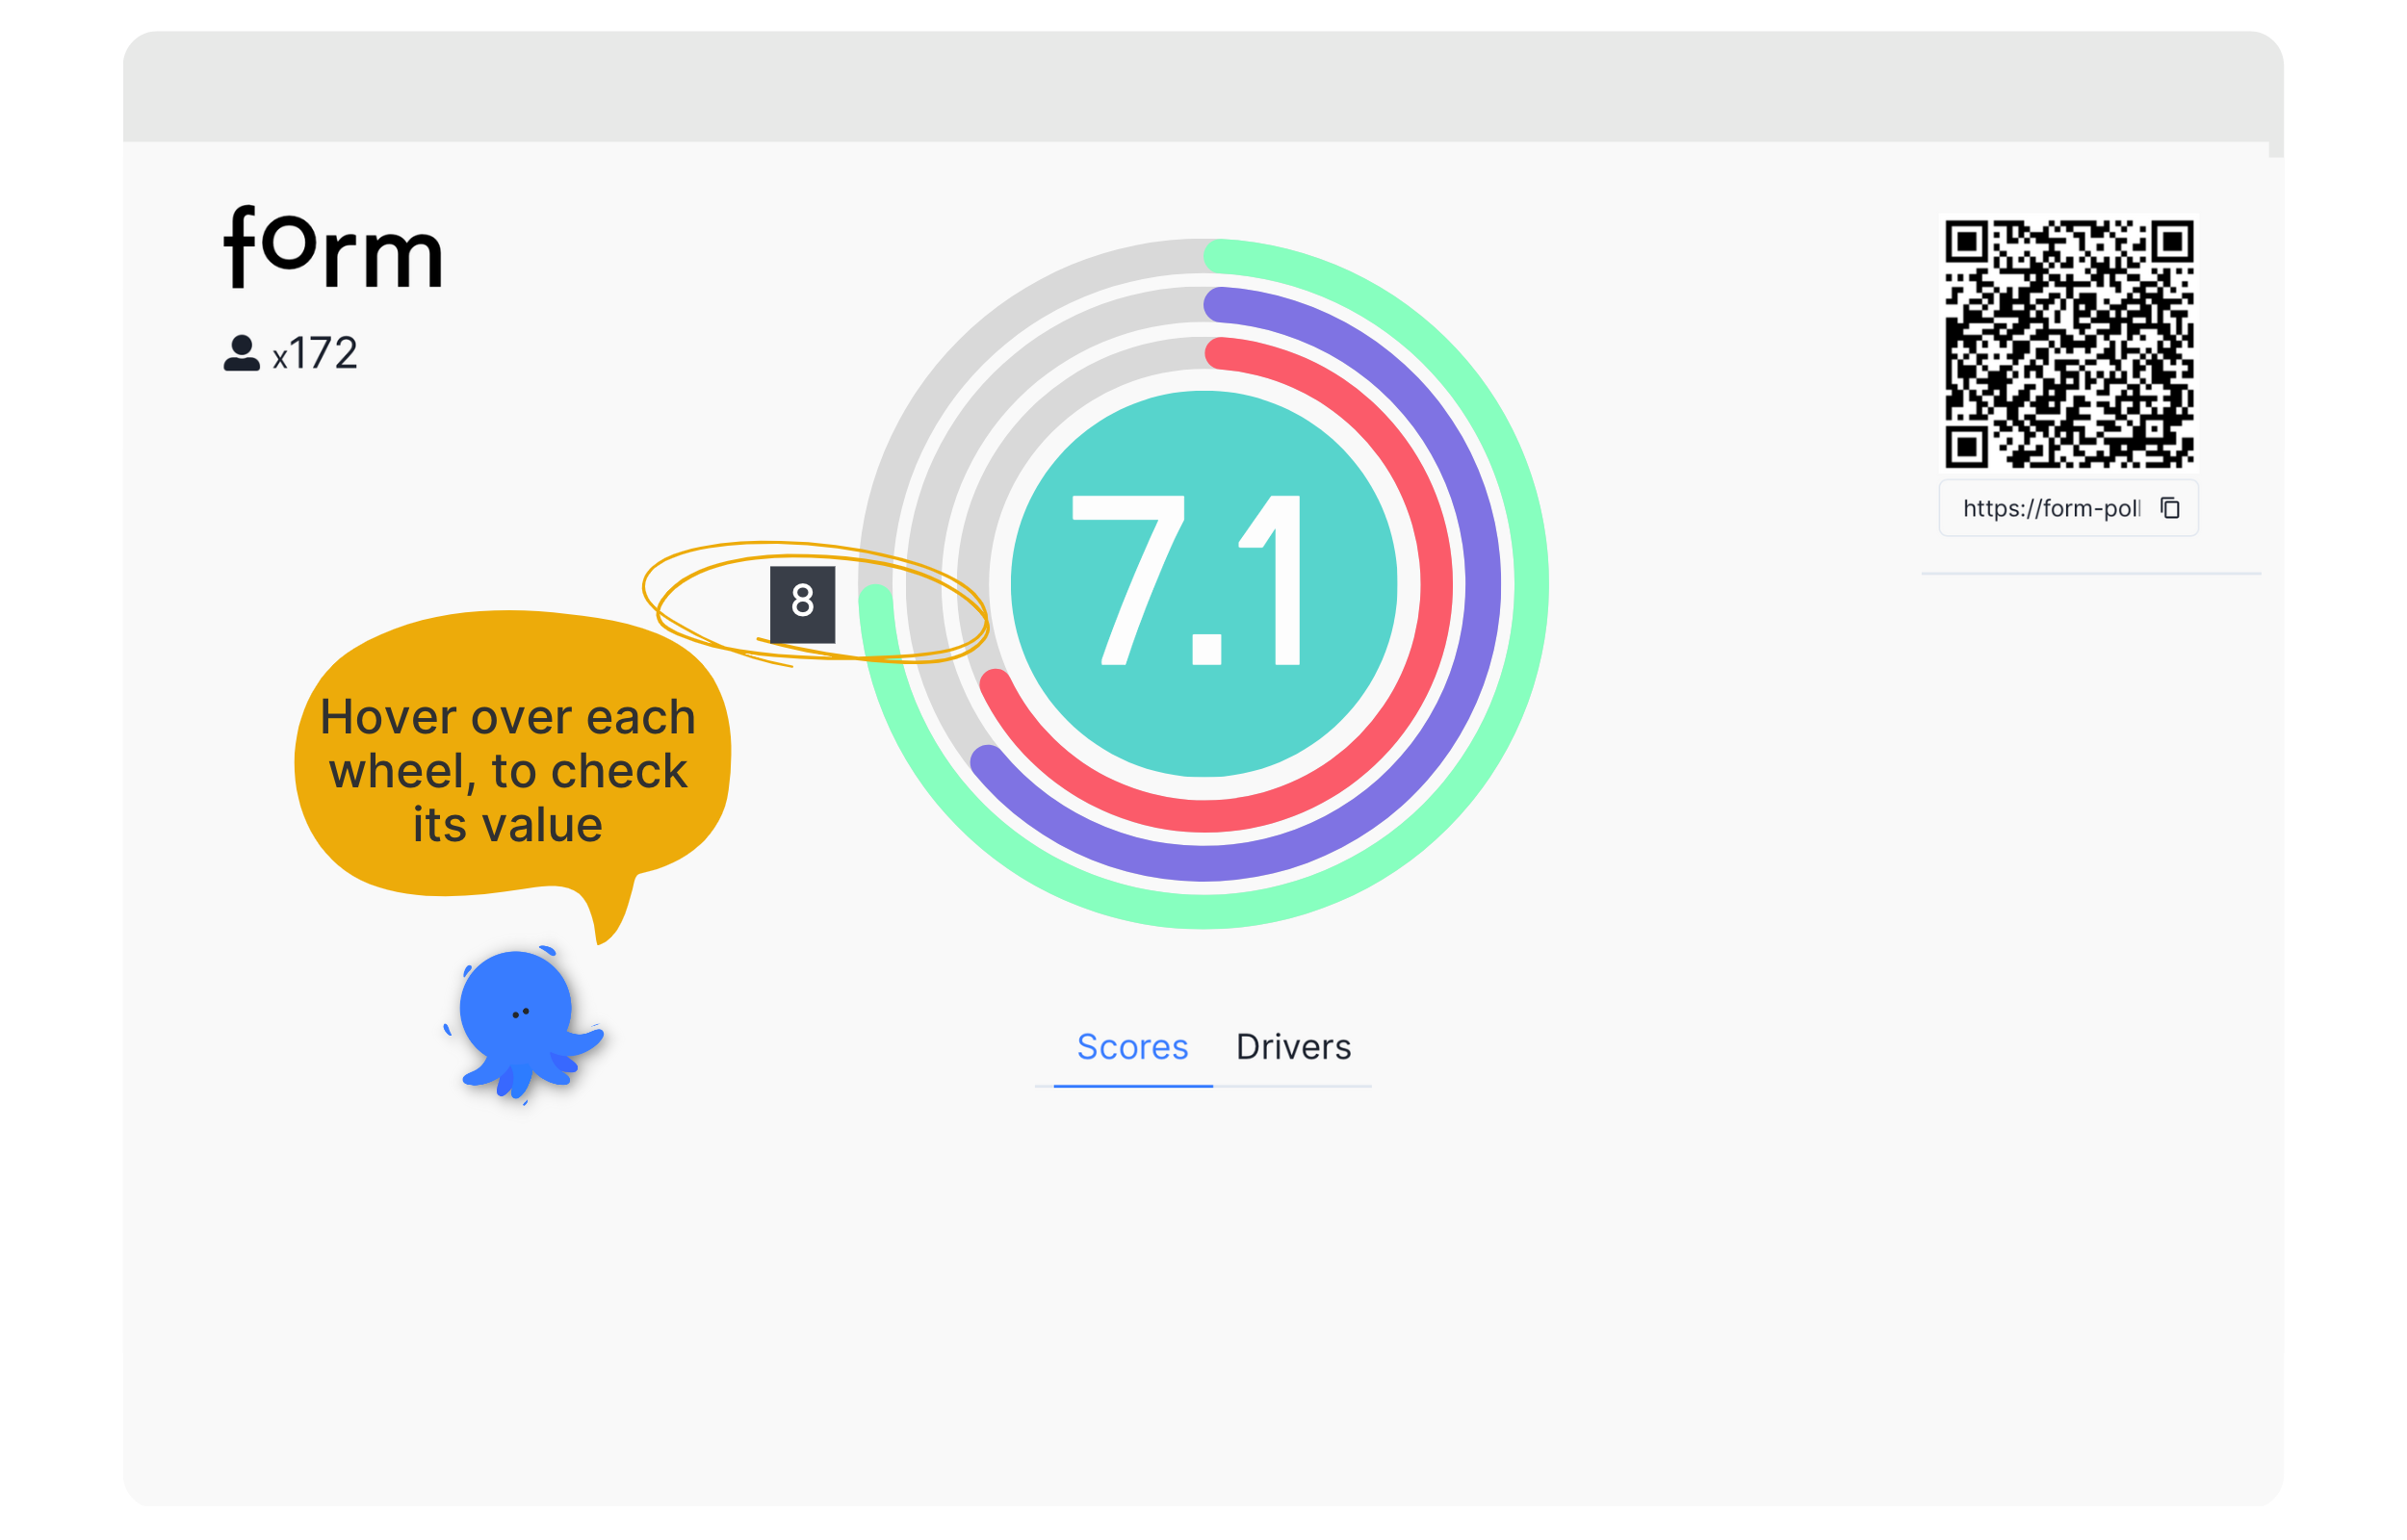
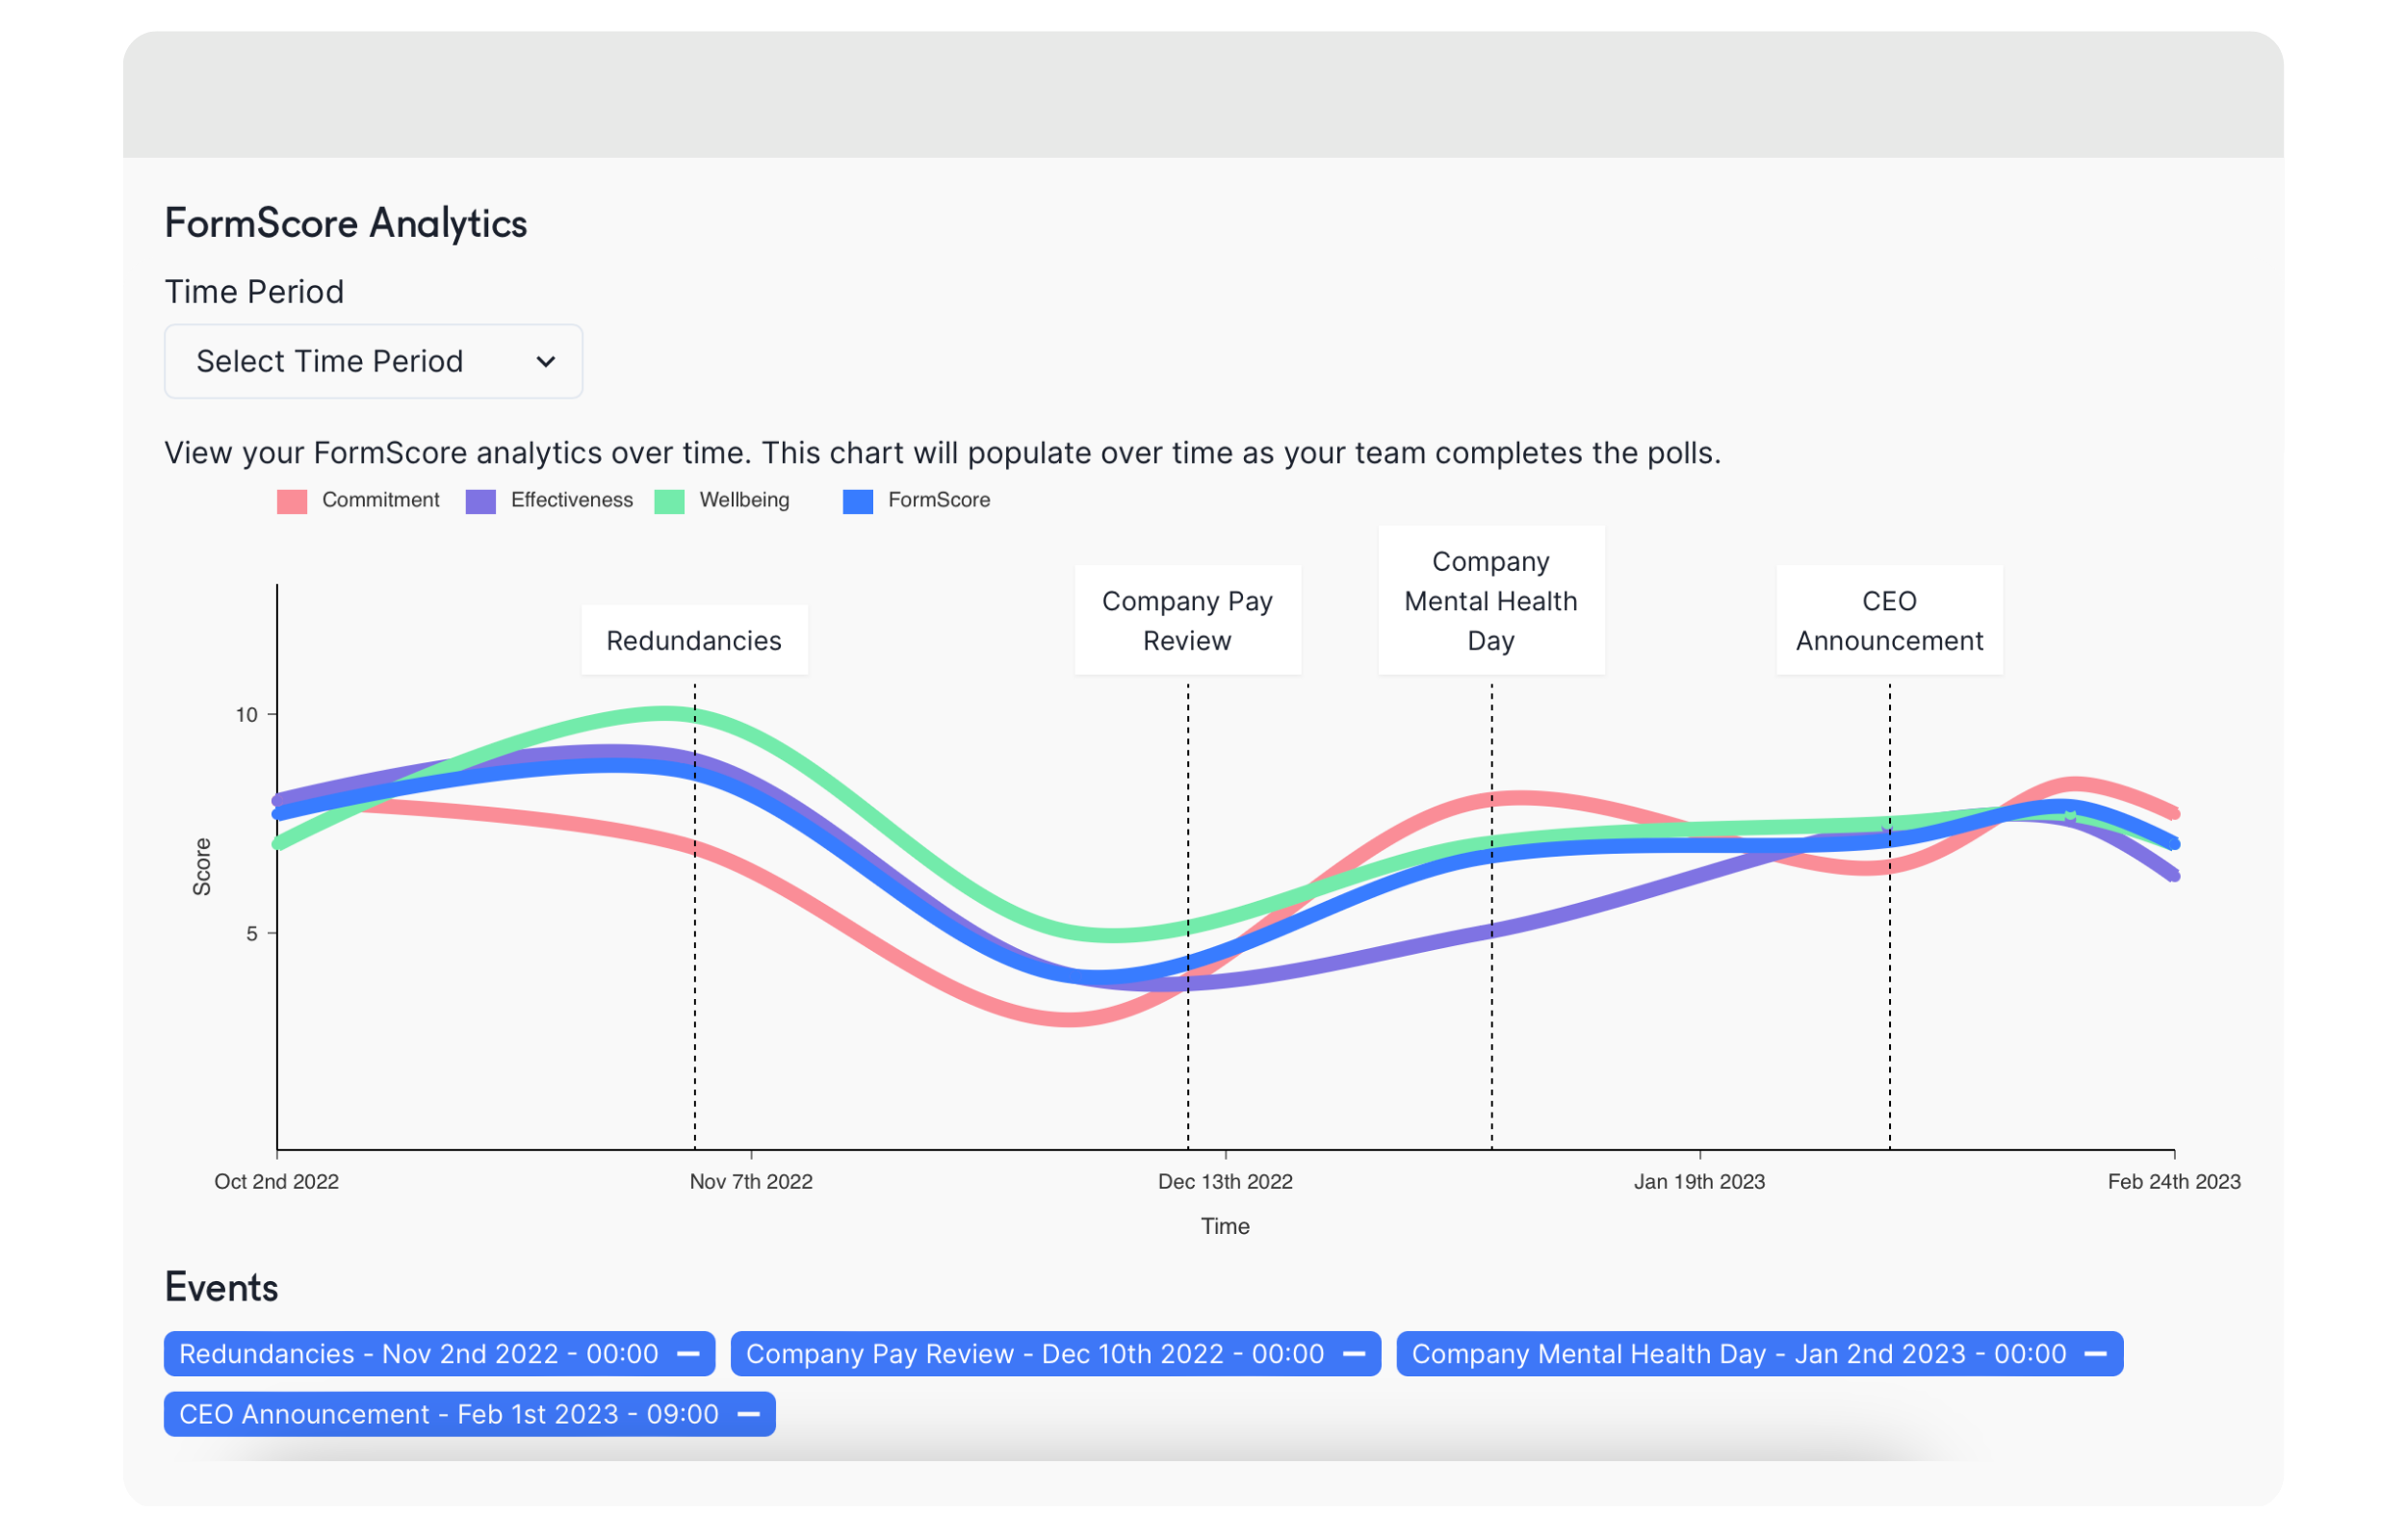
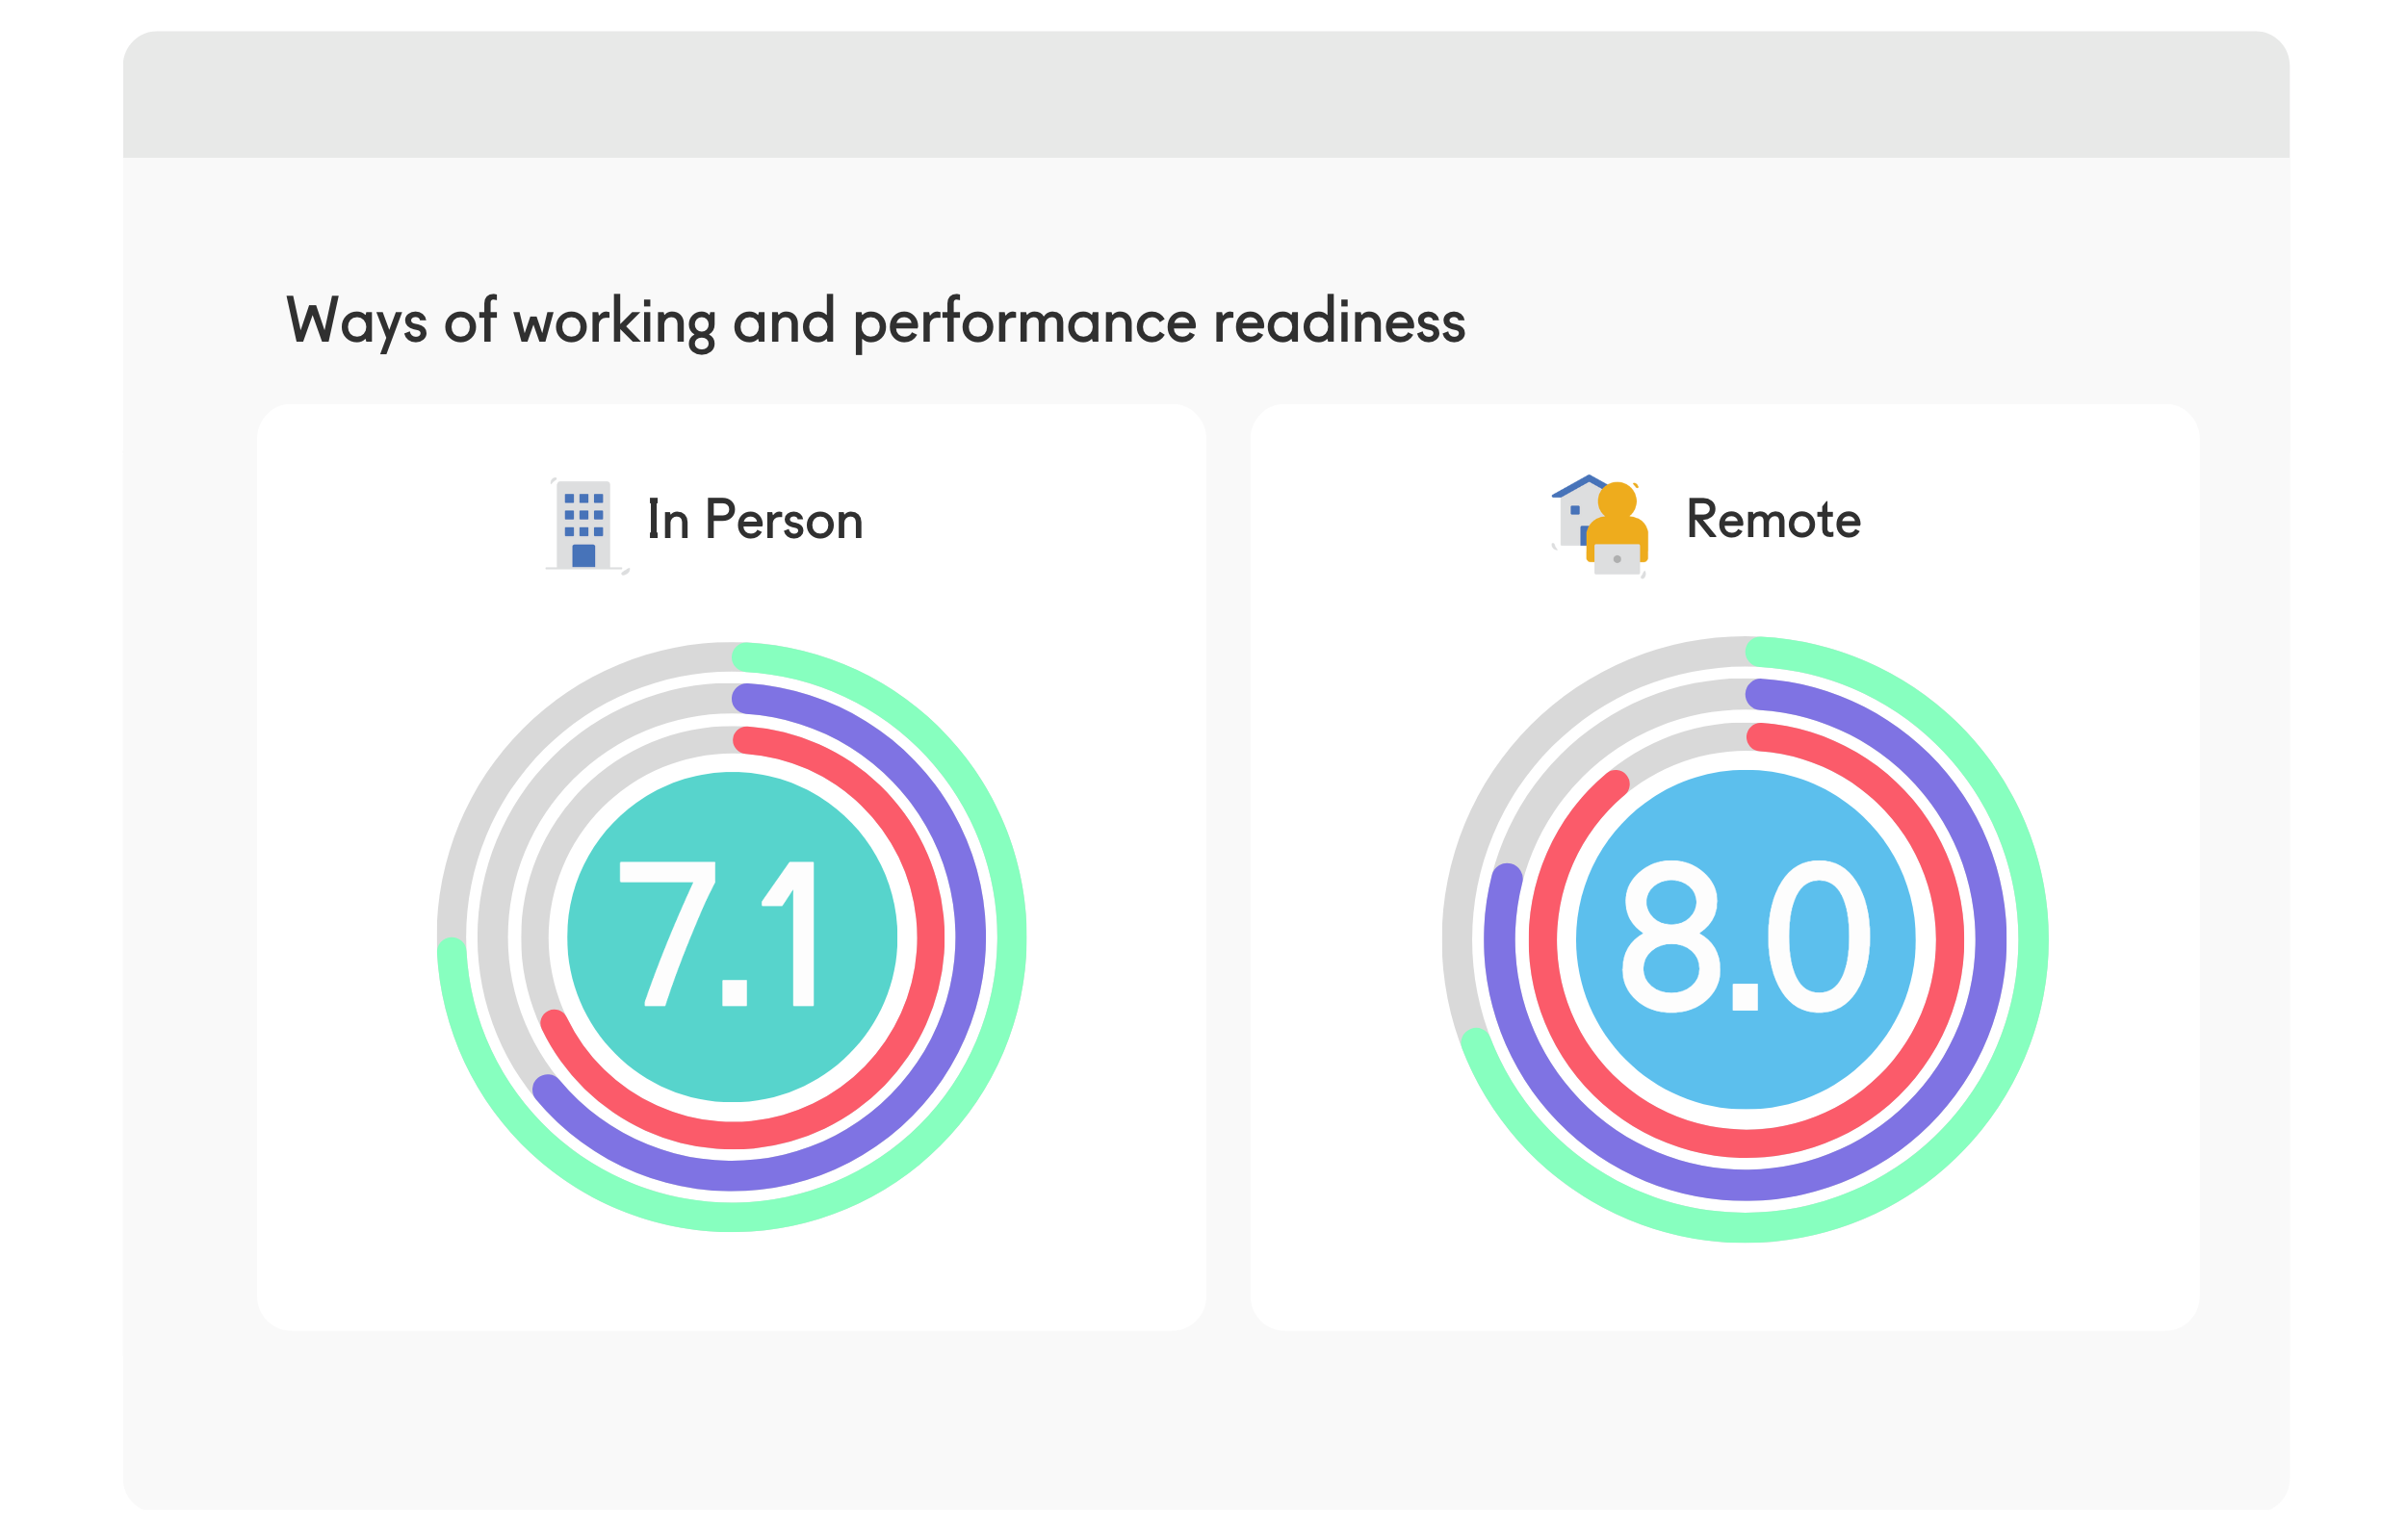
🎯 The 3 circles (shown at the top), represent the overall Wellbeing, Effectiveness, and Commitment scores. If you hover over each circle you’ll see the score for each category.
Here's everything else you can amend on the dashboard, to personalise the FormScore for Managerd solution to your own needs.